How Is Grow Light PPF Measured? Spheres, Goniophotometers and LM-79 Reports
PPF is the number a grow-light buyer compares first, and it is the number almost nobody can check on site. That is not a scandal; it is a consequence of what the quantity is. PPF is total photosynthetic photon flux — every photon between 400 and 700 nm leaving the fixture per second, summed over all directions — and measuring it requires a laboratory that can collect or map that entire output.
This article explains the two instruments that do the job, what a standardised test report contains, where the same fixture can legitimately produce different numbers, and how to read a report critically before you size a room from it.
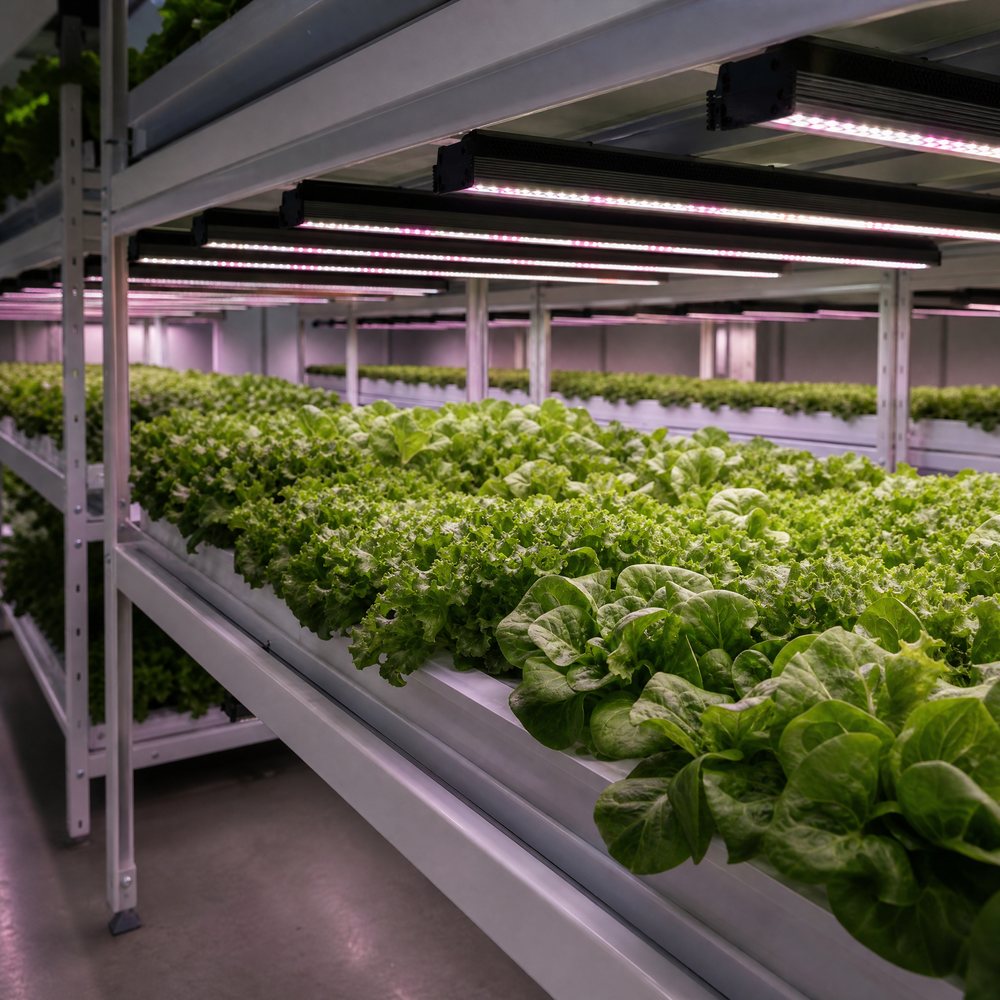
Why a handheld sensor cannot give you PPF
A quantum sensor reads PPFD — micromoles per square metre per second — at the point where it sits and in the plane it faces. That is a density measurement at one location. PPF is a flux measurement for the whole fixture. Moving a sensor around a room samples the resulting field; it never integrates the source.
The distinction matters commercially because the two numbers are connected by geometry rather than by a fixed conversion. A fixture with a high PPF hung too high, or spaced too widely, can produce a lower average PPFD on the canopy than a weaker fixture with better optics and tighter spacing.
An integrating sphere: total flux, quickly
An integrating sphere is a hollow, diffusely coated sphere with the fixture inside or mounted at a port. Light bounces repeatedly off the coating, so the detector sees an average rather than a direction, and the total flux follows from one reading after calibration and self-absorption correction.
Its strengths are speed and directness: the measurement is essentially the definition of total output, and it suits fixtures small enough to fit inside the sphere or to be mounted at its port. Its weaknesses follow from the same geometry. A large linear fixture may not fit, the sphere gives no information about distribution, and the baffle arrangement and lamp orientation must be handled carefully or the reading is biased.
A goniophotometer: distribution as well as total
A goniophotometer rotates the fixture, or moves a detector around it, recording intensity at many angles. Summing those measurements over the full sphere gives total flux; the angular data also yields the intensity distribution that a lighting design needs in order to predict PPFD at a given mounting height and spacing.
This is the method that produces usable design data rather than a single headline number. It is slower, needs a larger darkroom for big fixtures, and the quality of the result depends on angular resolution and on how well the far-field assumption holds for the fixture's dimensions.
What a standardised test actually fixes
A comparable PPF figure requires agreement on more than the instrument. A standardised photometric test fixes the electrical supply conditions, the stabilization criterion — the fixture must reach thermal equilibrium, not merely switch on — the ambient temperature, the orientation, and the reporting format. Without those constraints, two laboratories could measure the same fixture and publish numbers that differ by more than the buyer would tolerate.
Two practical consequences follow. First, a datasheet that quotes PPF without a test standard and a case or ambient condition is quoting an unanchored number. Second, the test condition is not the operating condition: a fixture stabilised in a temperate laboratory will run hotter in a greenhouse, and hotter LEDs deliver less light. That is why a thermal derating curve is more informative than a single rating.
The two methods compared
| Method | What it produces | Typical use | Main limitations |
|---|---|---|---|
| Integrating sphere | Total flux (PPF, lumens) | Fast type testing; compact fixtures; production sampling | Size limit; no distribution data; sensitive to baffle and orientation setup |
| Goniophotometer | Total flux plus angular intensity distribution | Design data, spacing tables, optical comparisons | Slower; large darkroom; resolution-dependent |
| Handheld quantum sensor | PPFD at one point and plane | Installation checks, uniformity surveys, dimming verification | Cannot produce PPF; cosine and calibration errors |
| Spectroradiometer | Spectral power distribution, from which PPF is integrated | Spectrum verification, far-red and UV claims | Cost; scan time; needs a stable setup |
Reading the report
- Identify the standard and edition the test claims to follow, and whether the report is accredited.
- Check the model and configuration: same wattage, same optic, same driver setting. A report for a different beam angle is not a report for your fixture.
- Look for the stabilization criterion and the ambient temperature used.
- Confirm the reported quantity: PPF, PPF efficacy, and whether the spectrum was measured or assumed.
- Ask for the angular data if you intend to design spacing from the fixture; total flux alone cannot predict uniformity.
- Ask for derating at the ambient temperature your room actually reaches in summer.
From laboratory PPF to installed PPFD
Even a perfectly measured PPF does not translate directly into crop light. Part of the output lands outside the growing area, part is absorbed by structures and glazing, and part arrives at a low angle where the canopy's own leaves shade it. Design practice accounts for this with a utilization factor rather than pretending the conversion is one-to-one.
The practical approach is to treat the laboratory figure as the fixture's specification and the installed measurement as the room's reality, then reconcile the two once, at commissioning. A single PPFD grid measured at canopy height tells you more about the installation than any datasheet, and it is the number to revisit when a crop underperforms.
Frequently asked questions
Can I measure PPF with a handheld quantum sensor?
Not directly. A quantum sensor measures PPFD at one point in a plane, which is a local density, not the total photon flux leaving a fixture. PPF in micromoles per second requires integrating the fixture's output over all directions, which is what a sphere or a goniophotometer does. A sensor can characterise the installed field, but it cannot reproduce the PPF rating.
Why does my measured PPFD disagree with the datasheet?
Most often because the geometry differs. The datasheet figure is usually quoted at a stated distance in free air, while the installed fixture sits near walls, reflective surfaces and neighbouring fixtures, and may be dimmed or running at a different temperature. Differences of a few percent are also normal between instruments of different cosine correction and calibration age.
What temperature is a PPF rating measured at?
A standardised test stabilises the fixture at a defined ambient condition before measuring, so the LED junction reaches a steady operating temperature. A rating taken in a 25 °C laboratory can be slightly optimistic for a fixture running in a hot greenhouse, which is why thermal derating curves are more useful than a single number.
Does a higher PPF always mean more light on the crop?
No. PPF is total output; what reaches the canopy depends on optics, mounting height, spacing and how much light lands outside the growing area. Two fixtures with identical PPF can deliver noticeably different average PPFD, and a narrow beam used at the wrong height can lose more to the aisle than a wider optic would.
Sources
- DesignLights Consortium. Horticultural lighting and application design resources (testing, metrics and design practice). designlights.org (PDF)
- DesignLights Consortium. Horticultural lighting terms and definitions (PPF, PPFD, efficacy). designlights.org
- US ENERGY STAR. Guidance on lumen maintenance testing and reporting for LED lighting. energystar.gov (PDF)
About the publisher
XineLam is an LED lighting manufacturer with 17 years of experience and 300+ patents in China and internationally. The company produces horticultural LED fixtures for greenhouses, indoor farms and research facilities, and supplies photometric test reports with the measurement conditions stated for each model.