How to Measure Light Uniformity Across a Grow Canopy
A single PPFD reading at the centre of a bench can be accurate and still be useless. What decides whether a crop matures evenly is the spread of light across the whole canopy, and that spread is measurable with a sensor, a tape measure and about twenty minutes.
Why the average PPFD hides the real problem
Growers usually quote one number for a lighting installation: the PPFD at the middle of the canopy. The DesignLights Consortium's terminology guide is precise about what that number is. PPFD is the density of photosynthetically active photons, in micromoles per square metre per second, arriving at a surface it calls the task plane. It answers the question "how bright will it be here", and nothing more.
The same guide describes a second quantity that receives far less attention: photosynthetic photon intensity distribution, or PPID, measured in micromoles per second per steradian. PPID carries direction as well as intensity, and the DLC notes that it is what allows designers to plan fixture spacing and to understand how a given distribution option affects the evenness of light in the work area. Evenness is therefore a design property of the luminaire and the layout, not something you can read off a centre-point measurement.
The practical consequence is straightforward. A bench averaging 500 µmol/m²/s with a low corner at 240 µmol/m²/s will grow two different crops on the same table. The average is correct. The installation is not.
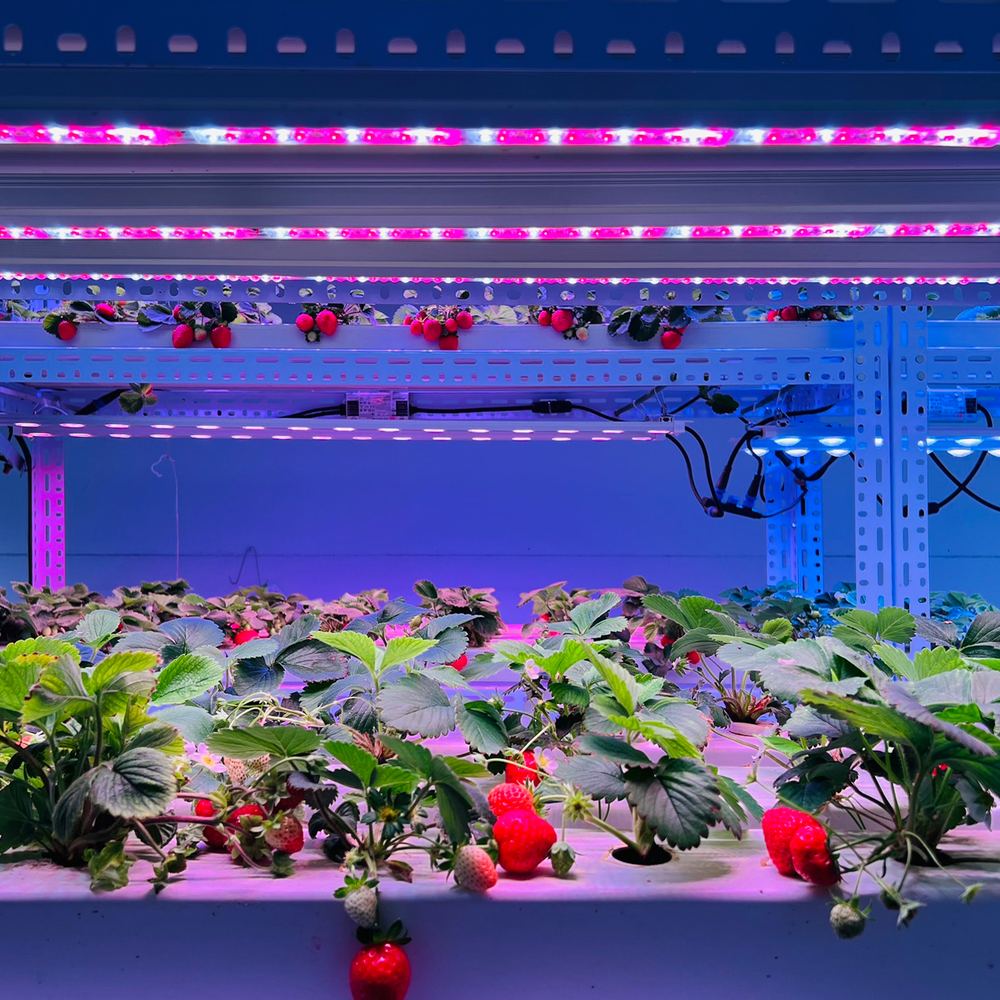
The three uniformity numbers worth recording
Three figures cover almost every practical question, and they take seconds to calculate once the readings exist.
- Min/max ratio. Divide the lowest reading by the highest. It is the bluntest measure and the easiest to explain to a team: 0.70 means the darkest point receives seventy per cent of the brightest.
- Coefficient of variation (CV). Divide the standard deviation of the readings by their mean. It uses every point rather than two extremes, so it is far less sensitive to one bad sensor placement.
- Edge-to-centre ratio. Divide the mean of the perimeter readings by the centre reading. This is the number that tells you whether the outer rows of a bench are being short-changed by the fixture layout.
Report all three, and always report the mean alongside them. A very even installation at an inadequate mean is still an inadequate installation.
A repeatable measurement procedure
- Fix the layout first. Measure after the fixtures are at their final hanging height and spacing. Changing either invalidates the whole dataset.
- Define the task plane. Use the top of the canopy, or the height the canopy will reach at its final stage if the crop is still filling in. Write down the height above the floor.
- Lay out a grid. Nine points for benches under about 1.5 m², 25 points above that. Keep the outer points roughly 10 cm inside the true edge, because readings taken half off the bench are not canopy readings.
- Block ambient light and your own shadow. Measure at night, in a dark room, or with the sunlight fully screened. Approach each point from the side and hold the sensor at arm's length so your body does not clip the beam.
- Let the sensor settle. Hold each position for the full averaging period of the meter, typically a few seconds, before recording. Note the meter model and its calibration date.
- Record, then calculate. Enter the readings into a spreadsheet and compute mean, standard deviation, min/max and CV. Keep the raw grid, not just the summary, because the map shows you where to move a fixture.
Comparing the metrics side by side
| Metric | How it is calculated | What it reveals | Common working target | Main weakness |
|---|---|---|---|---|
| Min/max ratio | Lowest reading ÷ highest reading | Worst-case spread across the canopy | 0.80 or above for a production bench | Driven by two points only; one misread destroys it |
| Coefficient of variation | Standard deviation ÷ mean | Overall dispersion using every point | 10 per cent or below | Can look acceptable while a corner is still failing |
| Edge-to-centre ratio | Mean of perimeter ÷ centre reading | Whether outer rows are under-served | 0.70 or above | Ignores variation along the perimeter itself |
| PPID and beam angle | From the luminaire photometric file | Design-stage prediction of evenness and spacing | Chosen per layout, not a pass/fail value | Describes the fixture, not the installed room |
The targets in the fourth column are working conventions used in commercial practice for acceptance checks, not values fixed by a lighting standard. No single uniformity threshold fits lettuce, tomatoes and a mother-stock bench at the same time, so treat them as starting points and adjust to what your crop has tolerated.
Worked example: nine readings from one bench
Nine readings taken on a 1.2 m by 1.0 m bench, in µmol/m²/s, arranged three by three:
| Row | Point 1 | Point 2 | Point 3 |
|---|---|---|---|
| Front | 520 | 505 | 540 |
| Middle | 480 | 530 | 510 |
| Back | 560 | 495 | 515 |
The mean is 517 µmol/m²/s and the sample standard deviation is about 24 µmol/m²/s, which gives a CV of roughly 4.6 per cent. The lowest reading is 480 and the highest 560, so the min/max ratio is 0.86. By both measures this is an even bench.
Notice what the grid adds that the summary does not. The low point sits in the middle row on one side, and the high point sits at a back corner, which usually points at a fixture offset along one axis rather than a general lack of light. That kind of diagnosis only exists in the map.
Where uniformity goes wrong
- Fixtures spaced for the catalogue footprint, not the room. A quoted coverage area assumes a mounting height the installer may not have used.
- One fixture fewer than the bench needs. The centre then reads on target while both ends fall away, which a single-point check cannot detect.
- Mixed fixture types or ages on one bench. Different optics and different lumen depreciation produce a step change in the grid.
- Reflective walls on one side only. A white partition can lift one edge and create a false sense of evenness.
- Sensor used without a cosine corrector, or held at an angle. Off-axis readings under-report, and they under-report most where the beam is most oblique, which is exactly at the edges.
What to accept, and when to move fixtures
If the min/max ratio clears your target and the mean meets the crop's requirement, stop. Equipment changes cost more than the yield they recover. If the min/max ratio is short but the map shows a single dip, adjust one fixture's position or angle before buying anything. If the whole perimeter is low while the centre is high, the layout needs another row of fixtures or a wider distribution optic, and no amount of re-aiming will fix it.
Re-measure after any change, and re-measure once a year. LED packages depreciate, lenses yellow, and a grid that passed at commissioning is not guaranteed to pass at year five. For the intensity and daily-light-integral side of the same installation, see the sizing method for PPFD and DLI, and the rest of the technical articles and guides.
Frequently asked questions
Should I measure uniformity at the canopy or at the fixture?
Measure at the canopy. PPFD is defined as photon density on a surface, so the meaningful plane is the top of the plant canopy, not the fixture face. A reading taken 10 cm below the fixture tells you about the luminaire; a reading at leaf height tells you what the crop receives.
How many measurement points do I need?
Nine points in a three by three grid are enough to detect gross imbalance on a bench smaller than about 1.5 square metres. Use 25 points in a five by five grid for larger benches, multi-bar installations, or any layout where you intend to change fixture spacing.
Does a diffuser or reflector improve uniformity?
It can, but not for free. A wider beam spreads photons over a larger area and lifts the lowest readings, which improves the min/max ratio, while the peak PPFD under the fixture falls. Whether that counts as an improvement depends on whether your limiting point or your average output is the constraint.
Can I use a phone app instead of a quantum sensor?
A phone camera estimates illuminance in lux and converts it with an assumed spectrum. That is useful for relative comparisons on the same fixture, but the absolute error against a cosine-corrected quantum sensor measuring 400 to 700 nm can be large, especially with narrow-band or far-red-heavy spectra. Use a calibrated quantum sensor when the figure has to be reported or used to set a DLI target.
About the publisher
XineLam is an LED lighting manufacturer with 17 years of experience and 300+ patents in China and internationally. The company designs and produces horticultural LED fixtures and LED drivers for greenhouse, indoor farm and vertical cultivation applications. This article is written as general technical education; uniformity targets and measurement practice should be adapted to the specific crop and installation.
Sources
- DesignLights Consortium, Horticultural Lighting Resources: Terms and Definitions. Definitions of PPF, PPFD, PPID and PPE, referenced to ANSI/ASABE S640 and ANSI/IES RP-16.
- DesignLights Consortium, Horticultural Technical Requirements V4.0, effective 18 April 2025. Minimum photosynthetic photon efficacy of 2.5 µmol/J for listed fixtures.
- Erik Runkle, Michigan State University Extension, Lighting the Way with LEDs. Selection criteria and light-distribution considerations for greenhouse LED systems.