Grow Light Uniformity: How to Read PPFD Distribution and Edge Drop
An average PPFD figure describes a whole canopy but not any single point on it. Two rooms can report the same average and produce visibly different crops, because what actually reaches a plant depends on where that plant is standing. This article explains what uniformity means, how it is measured, why the most commonly quoted uniformity metric can mislead, and how mounting height and fixture spacing shift the numbers at the edges of a bench or shelf.
What uniformity actually describes
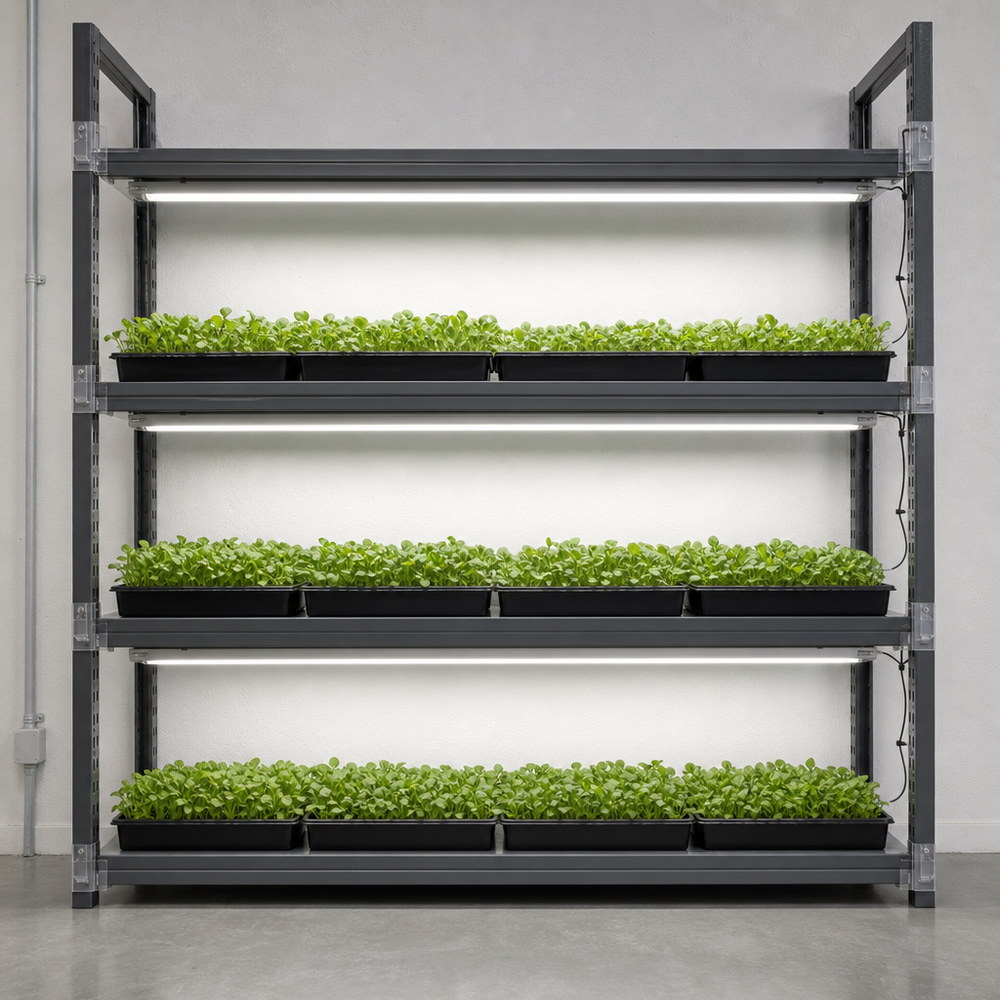
Photosynthetic photon flux density is measured in micromoles per square metre per second, and in any real installation that value is not the same everywhere. It is highest close to the fixture, lower towards the corners of the growing area, and lower still outside the footprint the fixture is designed to cover. Uniformity is the description of that spread.
It matters because plants respond to the light they receive individually, not to the room average. As the authors of a peer-reviewed study of horticultural light uniformity put it, maintaining a uniform photon irradiance distribution above the plant canopy is a fundamental goal in controlled environment agriculture, and spatial variation in photon irradiance below the light saturation point drives differences in individual plant development, which decreases the economic value of the crop. Uniformity is therefore not a cosmetic property; it is a yield and quality variable.
Why the minimum-to-average ratio can mislead
The metric most often quoted for uniformity is the ratio of the lowest PPFD value found on the growing surface to the average PPFD across it. It is easy to calculate and easy to put on a specification sheet, which is precisely why it circulates so widely.
The measurement study published in Horticulturae in 2022 tested that assumption directly. The authors measured photon irradiance distributions underneath two typical grow light installations using a 10 × 10 measurement grid with 100 mm spacing, and calculated photon irradiance at every grid point for 100 nm wide blue, green, red and far-red wavebands covering the 400–800 nm range. Their conclusion is explicit: the generally used uniformity metric defined as the minimum to average ratio of PPFD is not appropriate for the characterisation of light uniformity in horticultural lighting applications.
Two reasons explain the mismatch. A minimum is a single sample, so the whole description of the installation can hinge on one outlier reading taken at one awkward corner. And reducing a distribution to one number discards its shape, which is exactly the information a grower needs: whether the low readings are confined to a small corner or spread across a whole side of the bench. The study proposes an alternative: normalise photon irradiance to its maximum, analyse histograms built from the relative values, and consider the light response of the cultivated crop when comparing installations.
How to measure a distribution in practice
- Fix the measurement plane first. All readings have to be taken at the same height above the floor or bench, at the canopy height you actually intend to grow to. Readings taken at mixed heights cannot be compared with each other.
- Lay out a grid rather than sampling randomly. The published methodology uses a 10 × 10 grid with 100 mm spacing, which is fine enough to show structure in the pattern rather than just a rough centre-to-edge gradient.
- Record every grid point before interpreting anything. Note the highest value, then divide every reading by it to obtain relative values that can be compared between installations of different intensity.
- Group the relative values into a histogram. The shape shows whether the surface is broadly even with a small dim tail, or sharply peaked in the middle with large weak zones.
- Read the low end as a percentile rather than as a single minimum. The same study plots the 10th percentile of the distribution alongside the histogram, which is a more robust way to describe how low the dim areas go.
- Repeat the survey after any change to mounting height, fixture spacing or layout, and compare distributions rather than single numbers.
| Metric | Calculation | What it describes | Limitation |
|---|---|---|---|
| Minimum-to-average ratio | Lowest PPFD on the grid ÷ average PPFD | A one-line summary of the weakest point relative to the overall level | Built from a single sample and discards the shape of the distribution; the authors of the 10 × 10 grid study concluded it is not appropriate for horticultural lighting |
| Normalised photon irradiance | Each grid value ÷ the maximum grid value | The relative pattern of light across the surface, comparable between installations of different intensity | Relative only; it must be paired with an absolute PPFD figure to be actionable |
| Histogram of relative values | Relative values grouped into bins | The shape of the distribution and the size of the low-intensity tail | Requires a stated grid density and bin width to be reproducible |
| Percentile of the distribution | The value below which a set proportion of grid readings fall, for example P10 | How low the dim end of the surface goes, without depending on one outlier | Describes the low end only; it does not show where the weak zones are located |
| Specification-sheet uniformity figure | Supplier-defined | Fast to quote and easy to compare on paper | Definitions differ between suppliers, so the numbers are not comparable unless the measurement method and grid are stated |
Mounting height and edge drop
Mounting height is the single most controllable variable in the pattern. In the same measurement study, one installation was measured with the luminaire 1612 mm above the measurement plane and another with it only 200 mm above the plane. At the high position, only the flat middle portion of the emitted light determined the spatial distribution. At the low position, significantly lower PPFD values were measured at the boundaries of the target area, and the study attributes this difference to the low mounting height rather than to the fixture itself.
The mechanism is straightforward. Hanging a fixture higher spreads its output over a larger area and flattens the gradient, at the cost of reduced intensity at the canopy. Hanging it lower concentrates a bright pool directly beneath the fixture, which raises the average but makes the edges fall away sharply. The practical consequence is that uniformity and intensity cannot be optimised independently, so the height has to be chosen against a target PPFD rather than in isolation.
Industry guidance points in the same direction. The CEA Lighting Best Practices Guide published by the Resource Innovation Institute in March 2022 describes typical mounting heights anywhere from 3 to 10 feet above the canopy, notes that LEDs can be mounted closer to the crop while still providing higher light intensities with better uniformity, and recommends keeping fixture spacing consistent in both the X and Y directions. It also singles out one detail that is easy to overlook: fixture placement and layout have a direct effect on light levels at the edges of benches, which is exactly where the low readings in a uniformity survey tend to appear.
| Parameter | Value reported or recommended | Source |
|---|---|---|
| Measurement grid | 10 × 10 points, 100 mm spacing | Balázs et al., Horticulturae 8(7), 644 (2022) |
| Wavebands reported | 100 nm wide blue, green, red and far-red bands, 400–800 nm | Balázs et al., Horticulturae 8(7), 644 (2022) |
| Mounting heights compared | 1612 mm and 200 mm above the measurement plane | Balázs et al., Horticulturae 8(7), 644 (2022) |
| Typical mounting height range | 3 to 10 feet above the canopy | Resource Innovation Institute, CEA Lighting Best Practices Guide (2022) |
| Fixture spacing | Consistent spacing in both the X and Y directions | Resource Innovation Institute, CEA Lighting Best Practices Guide (2022) |
A short checklist before you buy or re-hang
- State the measurement plane, the grid density and the metric before comparing two installations; without all three, the numbers are not comparable.
- Report the distribution, not just its minimum. A histogram or a low-end percentile survives scrutiny; a single minimum does not.
- Check the bench edges and the corners of the room explicitly, since that is where the low readings concentrate.
- Keep fixture spacing even in both axes; uneven spacing produces a pattern that no amount of height adjustment will flatten.
- Treat any quoted uniformity figure that does not state its method as unverified rather than as good.
Frequently asked questions
What is a good uniformity value for a grow light installation?
There is no single number that suits every crop, because the acceptable spread depends on how strongly the crop's value responds to light intensity. More importantly, the most widely quoted summary, the minimum-to-average ratio of PPFD, compresses an entire distribution into one figure. The authors of the peer-reviewed measurement study concluded that this metric is not appropriate for horticultural lighting, and proposed instead normalising photon irradiance to its maximum and reviewing the resulting histogram together with the crop's light response.
Can a single quantum sensor measure uniformity?
A quantum sensor measures PPFD at one point, so uniformity is obtained by taking many readings on a regular grid and comparing them. In the published methodology the measurements were taken on a 10 × 10 grid with 100 mm spacing between points, which is what allows a distribution to be reconstructed rather than inferred from a single spot check.
Does a wider or longer fixture automatically improve uniformity?
Not on its own. Form factor and spacing both matter: best-practice guidance recommends keeping fixture spacing consistent in both the X and Y directions and reviewing how the layout affects light levels at the edges of benches. A larger fixture with uneven spacing can still leave weak zones at the perimeter of the growing area.
How high should a grow light be mounted?
Best-practice guidance places typical mounting heights somewhere between 3 and 10 feet above the canopy and notes that LEDs can be mounted closer to the crop while still delivering better uniformity. The correct value for a given room depends on the beam pattern and the size of the area, because raising a fixture spreads the light more evenly but reduces intensity, while hanging it low concentrates a bright pool in the middle and drops off sharply towards the edges.
About the publisher
XineLam is a LED lighting manufacturer based in Zhongshan, China, with 17 years of experience in LED lighting and 300+ patents in China and internationally. The company designs and produces horticultural and architectural LED luminaires. Where an installation needs a specific light distribution, the pattern should be confirmed by measurement on site rather than inferred from a catalogue figure.
Sources cited
- Balázs, L., Dombi, Z., Csambalik, L., Sipos, L. Characterizing the Spatial Uniformity of Light Intensity and Spectrum for Indoor Crop Production. Horticulturae 8(7), 644 (2022). doi:10.3390/horticulturae8070644 — https://www.mdpi.com/2311-7524/8/7/644
- Resource Innovation Institute. CEA Lighting Best Practices Guide, March 2022 — https://resourceinnovation.org/wp-content/uploads/2022/03/RII-Lighting-BPG-2022.pdf
- NC State University, Controlled Environment Horticulture programme — https://ceh.cals.ncsu.edu/