Do Lettuce and Tomatoes Need the Same LED Spectrum?
Growers who run both crops under one lamp often ask whether the spectrum is a compromise. It usually is not the spectrum that decides the outcome first; it is how much light each crop needs, and only then which wavebands change the traits you are paid for.
The short answer
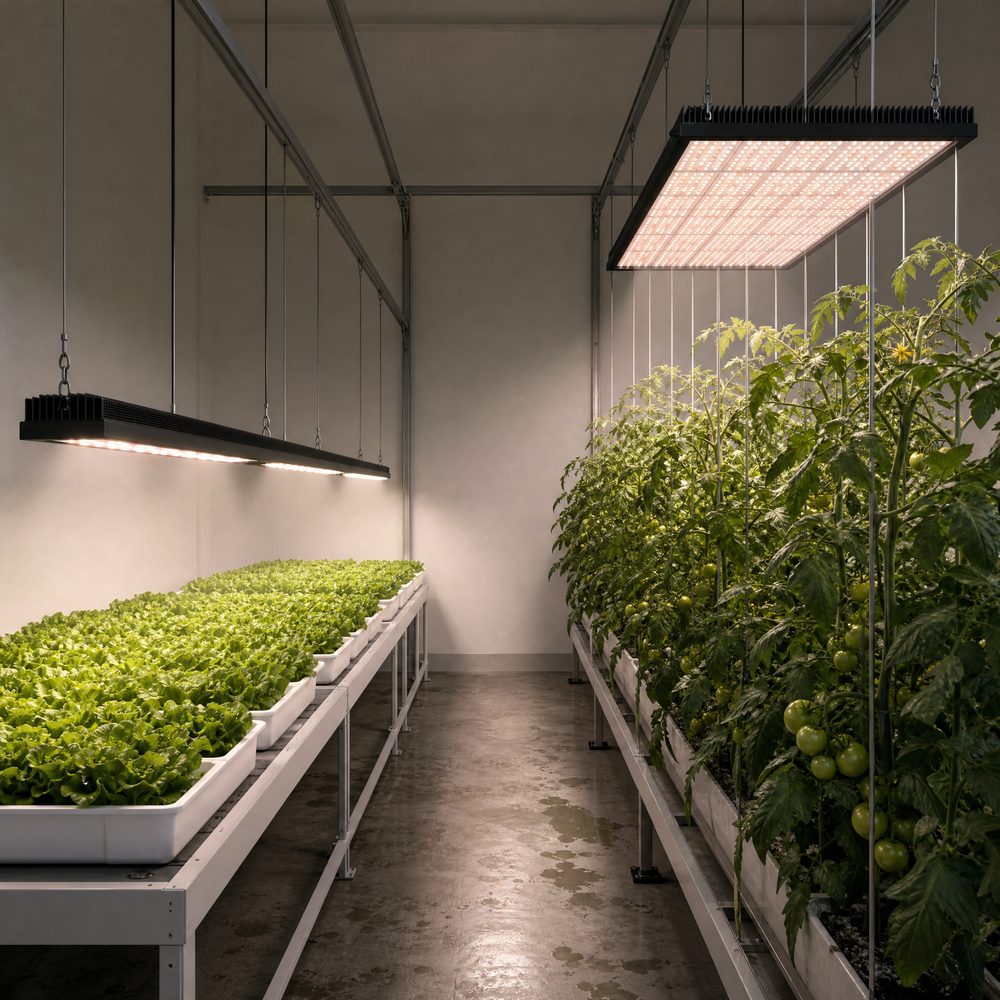
Lettuce and tomato do not share one ideal spectrum, but the larger difference between them is quantity. Cornell University's controlled environment agriculture programme puts hydroponic lettuce at 15 to 17 mol per square metre per day, and notes that going above that range can trigger tipburn, a calcium-related disorder. Tomato is listed at 20 to 30 or more mol per square metre per day for maximum yield.[1]
That is a gap of roughly 1.5 to 2 times the daily light integral. No spectrum choice compensates for a tomato crop running at lettuce intensity, and no red-to-blue ratio protects lettuce from being over-lit. Spectrum matters, but it operates on top of an intensity decision that has already been made.
What each crop is actually asking for
The table below converts the documented daily targets into an average PPFD for a 16-hour photoperiod, so the numbers can be checked against a fixture datasheet. It assumes no light losses between the luminaire and the canopy.
| Dimension | Hydroponic lettuce | Greenhouse tomato |
|---|---|---|
| Daily light integral target | 15–17 mol/m²/day; above this, tipburn risk rises | 20–30+ mol/m²/day for maximum yield |
| Average PPFD over 16 h | about 260–295 µmol/m²/s | about 350–520 µmol/m²/s |
| Canopy shape | Short, dense, harvested as leaf; one light plane | Tall, staked, multi-layer; lower trusses sit far from the fixture |
| What spectrum changes | Leaf quality traits and nitrogen metabolism respond to added wavebands | A broad PAR spectrum improved yield and fruit metabolites against HPS |
| Dominant risk | Over-lighting for the leaf area, leading to tipburn | Under-lighting the lower canopy, and electricity cost per mol delivered |
| Useful fixture behaviour | Dimming at 10–20 percent steps, low mounting height | High output at canopy, wide beam, or interlighting for lower trusses |
Why the red-to-blue ratio is not a specification
A ratio describes two numbers and hides the rest of the distribution. Two fixtures can both be sold as "red and blue" while differing in peak wavelength, bandwidth and how much energy sits between the peaks. Those differences show up in plant response.
Li and colleagues grew lettuce under four spectra in a recycled hydroponic system: 75 percent red plus 25 percent blue, and three variants that kept a 60/20 red and blue base and added 20 percent green, purple, or far-red light respectively. The treatments were compared on quality parameters and on nitrogen metabolism, including the expression of assimilation-related genes, and the added wavebands changed the results.[2] The practical reading is narrow but useful: a red-to-blue ratio alone does not predict leaf quality, and a small addition outside the red and blue peaks is not automatically neutral.
For lettuce that points toward trials rather than catalogue numbers. Two spectra with the same ratio can behave differently on nitrate content, colour and fresh weight, and the direction of the difference depends on the cultivar and on the intensity at which it is grown.
What the tomato data show
Tomato is a different problem because the harvested organ is a fruit and because the canopy is deep. Dannehl and colleagues compared a LED fixture whose emission covered most of the 400 to 700 nm range with high-pressure sodium lighting. Plants under the LED fixture were taller and produced about 14 percent more fruit yield, with lycopene 18 percent and lutein 142 percent higher; transpiration was about 40 percent lower and light use efficiency about 19 percent higher, while beta-carotene did not differ.[3]
Note what that study does not claim. It does not identify a winning red-to-blue ratio, and it does not say that a narrow red and blue recipe would have failed. The measured advantage came from covering the PAR range more completely than HPS does, at comparable installed power. For a grower choosing between fixtures, that is an argument for asking how much of 400 to 700 nm is actually populated, and how efficiently, rather than for chasing a ratio.
Applying it in a two-crop room
- Set the intensity target per crop first. Take 15–17 mol/m²/day for lettuce and 20–30+ for tomato, then convert to PPFD for your photoperiod before comparing any fixtures. A 16-hour day at 300 µmol/m²/s delivers 17.3 mol; at 500 µmol/m²/s it delivers 28.8 mol.
- Measure at the canopy, not at the fixture. Distance and beam angle decide how much of the published output lands on the leaf. A wide beam at low height usually beats a narrow beam raised for coverage.
- Treat lettuce as the ceiling, not the floor. Size the installation for tomato and dim or raise it over lettuce; the reverse arrangement leaves tomato permanently short of light.
- Ask for the spectral power distribution. Michigan State University Extension points out that plant lighting standards are developed so that products can be described and compared consistently.[4] A spectrum curve with stated measurement conditions is checkable; a ratio is not.
- Watch photoperiod separately from spectrum. Extending hours raises DLI, but for lettuce the documented constraint is the daily total, where 15–17 mol is already the upper end of the usual range.
Frequently asked questions
Can one LED fixture serve both lettuce and tomato?
Often yes, provided it is dimmable and can deliver the higher target at the tomato canopy without over-lighting the lettuce. Tomato needs roughly 20 to 30 or more mol per square metre per day for maximum yield, while hydroponic lettuce is usually grown at 15 to 17. A fixture sized for tomato can be dimmed or raised over lettuce, but a fixture sized only for lettuce will leave tomato short.
Is a higher blue share always better for lettuce?
The published work does not support a single best blue percentage. In a 2021 comparison, lettuce grown under 75 percent red plus 25 percent blue was compared with three spectra that kept the red and blue share and added green, purple or far-red light; the added wavebands changed quality parameters and nitrogen metabolism. The response depends on cultivar, intensity and the background spectrum, so a local trial is more reliable than a headline ratio.
Does a wider spectrum matter more than the red-to-blue ratio for tomato?
For tomato the documented gain came from broadening coverage rather than from a specific ratio. A 2021 study compared an LED fixture whose emission covered most of the 400 to 700 nm range with high-pressure sodium lighting and reported about 14 percent more fruit yield, 18 percent more lycopene and higher light use efficiency, along with taller plants and lower transpiration.
How do I compare two spectrum claims before buying?
Ask for the spectral power distribution and the test conditions rather than a marketing ratio. Michigan State University Extension notes that plant lighting standards exist so that products can be described and compared consistently; a report that states photon flux, spectrum and measurement distance is more useful than a percentage breakdown with no method.
About the publisher
XineLam is a LED lighting manufacturer with 17 years of experience and 300+ patents in China and internationally. The company designs and produces horticultural luminaires, drivers and thermal assemblies for greenhouse, indoor farm and research applications. This article is educational; spectrum and intensity decisions should be confirmed with a measurement at the canopy in the room where the crop will be grown.
References
- Cornell University, Controlled Environment Agriculture. Greenhouse Lighting (factsheet, PDF). Daily light integral targets for lettuce and tomato; lamp lifetime comparisons. https://cea.cals.cornell.edu/files/2019/07/Greenhouse-Lighting.pdf
- Li J., Wu T., Huang K., Liu Y., Liu M., Wang J. (2021). Effect of LED Spectrum on the Quality and Nitrogen Metabolism of Lettuce Under Recycled Hydroponics. Frontiers in Plant Science 12:678197. https://www.frontiersin.org/journals/plant-science/articles/10.3389/fpls.2021.678197/full
- Dannehl D., Schwend T., Veit D., Schmidt U. (2021). Increase of Yield, Lycopene, and Lutein Content in Tomatoes Grown Under Continuous PAR Spectrum LED Lighting. Frontiers in Plant Science 12:611236. https://pmc.ncbi.nlm.nih.gov/articles/PMC7952642/
- Runkle E. (2017). Developing new plant lighting standards. Michigan State University Extension. https://www.canr.msu.edu/resources/developing-new-plant-lighting-standards