Lighting design · Energy planning
Lighting Power Density: How Many Watts per Square Metre Does a Grow Room Need?
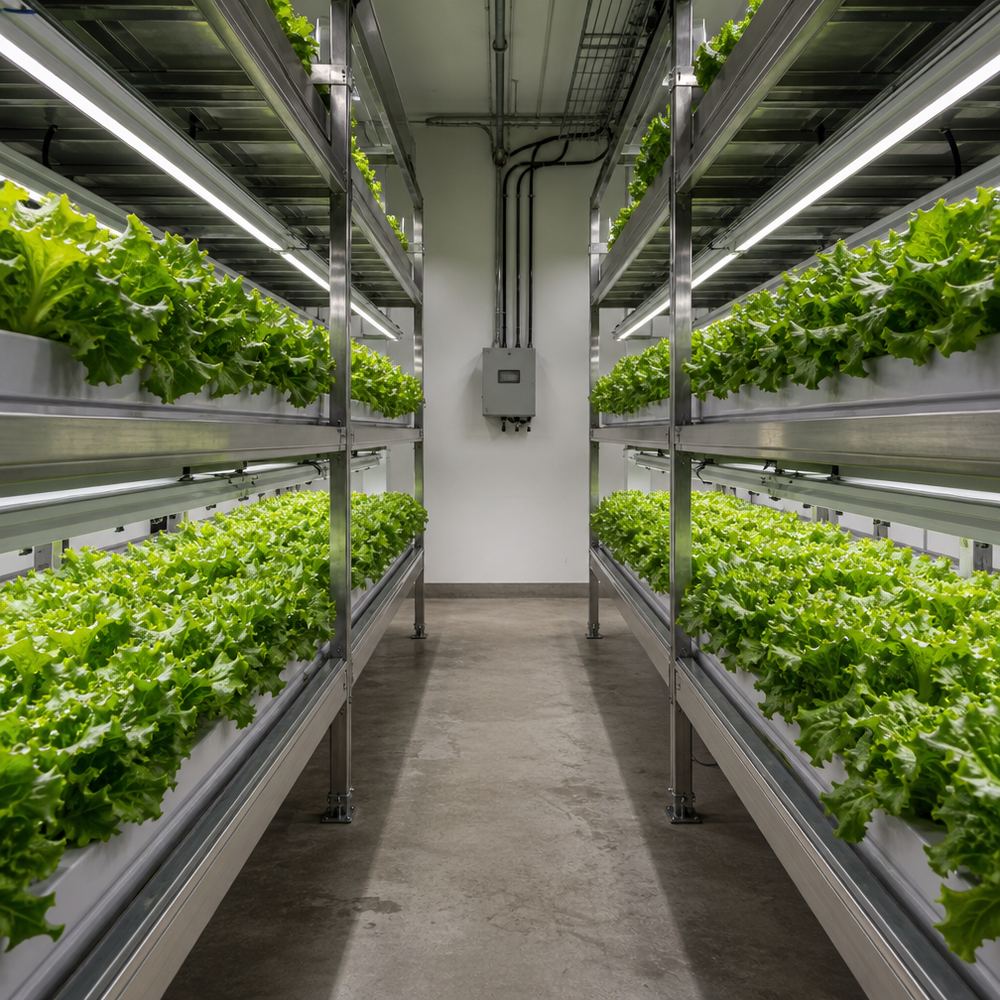
The short answer
Most horticultural installations run somewhere between 80 and 300 watts per square metre of lit area. The useful figure is not chosen from a catalogue, though: it falls out of three decisions — the daily light integral the crop needs, the efficacy of the fixtures you can buy, and the optical losses between the fixture and the leaf.
Working backwards is more reliable than working forwards. Set a DLI target, divide by the photoperiod to get the PPFD you need at the canopy, divide by fixture efficacy and a utilisation factor to get the power density, and only then choose a fixture count. A room designed forwards from "this fixture is 600 W" usually ends up either overdosed with light in the centre or short of it at the edges.
What lighting power density actually measures
Lighting power density (LPD) is installed electrical input power divided by the lit area, expressed in W m⁻² (older documents use W ft⁻², where 1 W ft⁻² equals about 10.8 W m⁻²). Three definitions matter if two people are to compare numbers honestly:
- Nameplate or metered. Use actual input power, including driver losses. A fixture rated "600 W" may draw 640 W at full output and 1.05 power factor.
- Floor area or canopy area. In a single-layer greenhouse the two are close. In a vertical farm with five tiers, the building floor area understates the lit area by a factor of five, and an LPD quoted against floor area becomes meaningless.
- Design or as-run. Installed density at 100% output is what the electrical design must support; the as-run density after dimming is what the energy bill reflects.
The conversion: from W m⁻² to PPFD and DLI
Fixture efficacy is the exchange rate between electricity and photons, quoted in micromoles per joule (µmol J⁻¹), which is numerically identical to micromoles per second per watt. The DesignLights Consortium maintains a horticultural lighting qualification programme with minimum efficacy thresholds for listed products, which is a practical place to check what the market currently delivers (designlights.org). The utilisation factor accounts for light that leaves the fixture but never reaches the canopy — spill at the edges, absorption by structure and floor, and the cosine losses of a wide beam mounted high.
DLI (mol m⁻² d⁻¹) = PPFD × hours × 0.0036
| Power density (W m⁻²) | PPFD at 2.5 µmol J⁻¹ | DLI at 2.5 µmol J⁻¹ | PPFD at 3.2 µmol J⁻¹ | DLI at 3.2 µmol J⁻¹ |
|---|---|---|---|---|
| 100 | 213 | 12.3 | 272 | 15.7 |
| 150 | 319 | 18.4 | 408 | 23.5 |
| 200 | 425 | 24.5 | 544 | 31.3 |
| 300 | 638 | 36.7 | 816 | 47.0 |
The table shows why power density alone is a weak specification. Moving from 2.5 to 3.2 µmol J⁻¹ at the same 200 W m⁻² buys about 28% more photons for the same electricity, and the same 300 W m⁻² can deliver anything from 638 to 816 µmol m⁻² s⁻¹ depending on the hardware. Efficacy is not a marketing detail; it is the term that decides whether the electrical service you paid for turns into light or heat.
Setting the target from the crop, not the catalogue
Read the crop's DLI requirement first, then invert the formula. The values below are common design targets for the stated crops and are deliberately given as ranges, because cultivar, climate and market grade all shift them.
| Crop group | Typical DLI target (mol m⁻² d⁻¹) | Required PPFD (µmol m⁻² s⁻¹) | Implied power density (W m⁻²) |
|---|---|---|---|
| Microgreens | 8–12 | 139–208 | 55–82 |
| Lettuce and leafy greens | 14–17 | 243–295 | 95–116 |
| Basil and culinary herbs | 15–20 | 260–347 | 102–136 |
| Tomato and cucumber (supplemental) | 20–30 | 347–521 | 136–204 |
| High-light flowering crops | 35–45 | 608–781 | 238–306 |
Two cautions. First, supplemental lighting in a greenhouse is added to daylight, so the target is the shortfall on the darkest weeks, not the annual average; a winter design day can require more than twice the summer density. The University of Arizona Controlled Environment Agriculture Center's discussion of supplemental lighting design covers this sizing logic in more detail (CEAC, PDF). Second, more light is not automatically more yield: above the crop's light saturation point the marginal gram per mole falls sharply, and the added electricity buys heat instead.
Where the watts actually go
An LPD figure describes the electricity entering the room, not the light leaving the fixture. Typical losses, in the order they occur:
- Driver and optical losses inside the fixture — usually 8–15% of input power, already reflected in the efficacy figure if it is a whole-fixture value rather than a diode value.
- Mounting height and beam angle — raising a fixture from 30 cm to 60 cm above the canopy roughly quadruples the area it covers and quarters the intensity directly beneath it, before any wall losses.
- Room geometry — reflective walls return some light, open aisles and dark floors absorb it. A 10% swing in utilisation between two nominally identical rooms is normal.
- Depreciation — lumen maintenance and dirty diffusers remove a few percent a year. Design at installation, but budget the maintenance.
All the electricity that does not leave as photons ends up as heat in the room, and even the photons become heat once absorbed. For cooling-load purposes, lighting power density can be treated as a near-equal heat load, which is why a jump from 150 to 300 W m⁻² typically doubles the sensible cooling requirement of a sealed room.
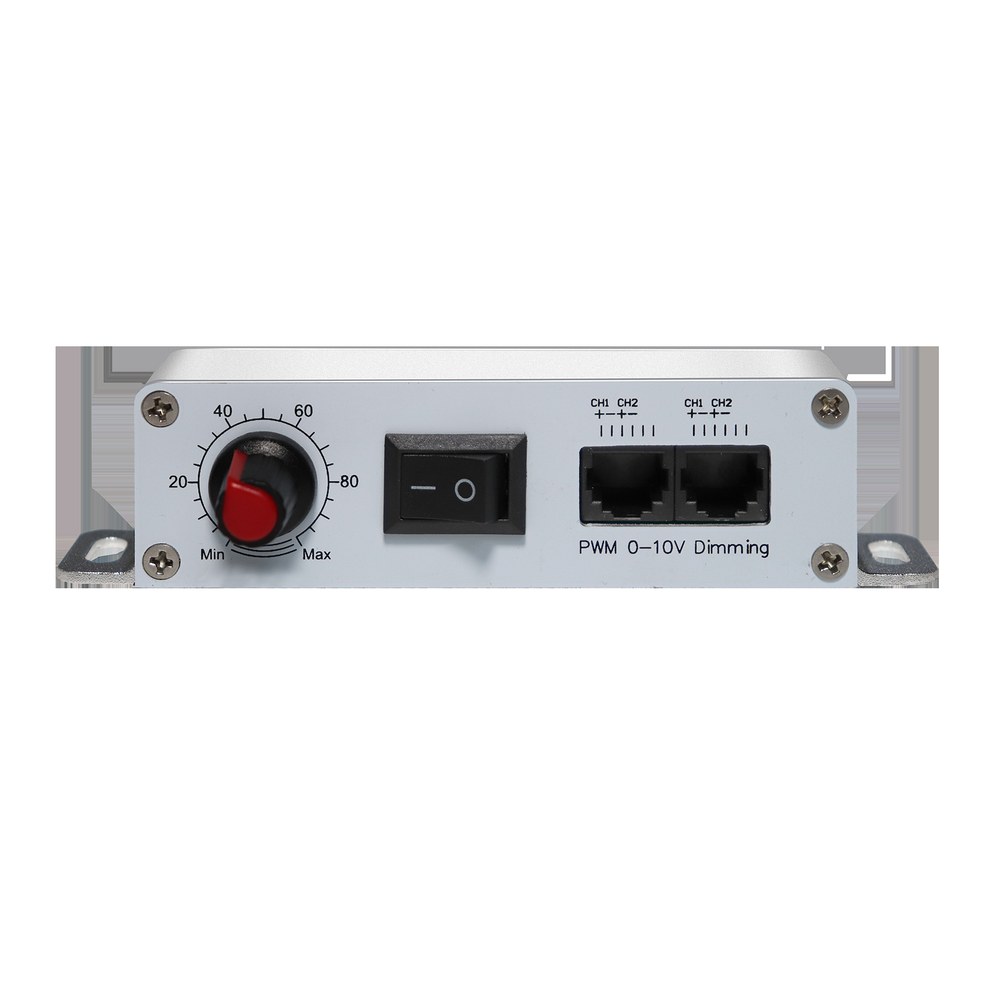
Part-load behaviour and why the meter disagrees with the maths
Dimming is the normal operating state of a well-designed room, and it is where simple LPD arithmetic drifts. Light output tracks the dimming command closely, but driver efficiency is usually best near 70–100% load and falls at the bottom of the range. A fixture dimmed to 30% often delivers 30% of the photons for 33–38% of the input power, and standby consumption of networked drivers adds a small constant at the very bottom.
For energy reporting, measure. A clamp meter on one circuit at three dimming levels gives a more defensible curve than any datasheet, and it captures the difference between a 0–10 V analogue signal and a PWM channel, which dim differently at the low end.
Checking the power density of an existing room
- Count fixtures per zone and multiply by metered input power at the current dimming level. Do not use the marketing wattage.
- Measure the lit area for that zone — canopy footprint, not building footprint, and multiply by the number of tiers.
- Divide. That is the as-run density; repeat at 100% output for the design figure the electrical service must carry.
- Measure PPFD at canopy level in the same zone. The ratio of measured PPFD to the theoretical value is your real utilisation factor, and it is the number to reuse for the next room.
- Check the service: continuous lighting loads are normally planned at no more than 80% of the breaker rating, and LED drivers add inrush current at switch-on.
About the publisher
XineLam is an LED lighting manufacturer with 17 years of experience in LED lighting and 300+ patents in China and internationally. The company produces LED grow lights, linear horticultural luminaires and dimmable driver assemblies for greenhouses, vertical farms and research facilities, and supports lighting layouts with photometric data rather than nameplate wattage alone.
Frequently asked questions
What is a typical lighting power density for a grow room?
Most installed horticultural lighting falls between 80 and 300 W m⁻² of lit area. Microgreens and propagation sit near the bottom of that range, lettuce and herbs in the middle, and high-wire tomato, cucumber or high-light flowering crops at the top. The number that matters is the resulting PPFD and DLI, not the watts themselves.
Does higher lighting power density always mean more light?
No. Two rooms at the same 200 W m⁻² can differ by more than 40% in canopy PPFD if one uses 2.2 µmol J⁻¹ fixtures and the other 3.3 µmol J⁻¹, and the gap widens further with mounting height, reflector design and wall losses. Power density sets the electrical budget; efficacy and optics decide how much of it reaches the canopy.
How do I convert watts per square metre to PPFD?
Multiply power density by fixture efficacy in micromoles per joule, then by a utilisation factor for optical and room losses, typically 0.8 to 0.9 in a well-designed room: PPFD = W m⁻² × µmol J⁻¹ × utilisation. Multiply the result by photoperiod hours and by 0.0036 to obtain DLI.
Does dimming reduce power density proportionally?
Almost, but not exactly. Light output tracks the dimming command closely, while electrical input falls slightly less than proportionally because driver efficiency drops at part load. A 50% dim typically gives about 50% of the photons for 52–58% of the input power, so metered data is preferable to a linear assumption when reporting energy use.
Sources
- DesignLights Consortium. Horticultural Lighting — qualification programme and technical requirements for LED horticultural luminaires.
- University of Arizona Controlled Environment Agriculture Center. Some Thoughts on Supplemental Lighting for Greenhouse Crops (PDF).