PPF vs PPFD: What Is the Difference in Grow Light Metrics?
PPF and PPFD are usually printed side by side on the same grow light datasheet, and growers often read them as two ways of saying the same thing. They are not. One number belongs to the luminaire; the other belongs to a specific square metre of your canopy. Confusing them is the most common reason a fixture that looked strong on paper under-performs in the room.
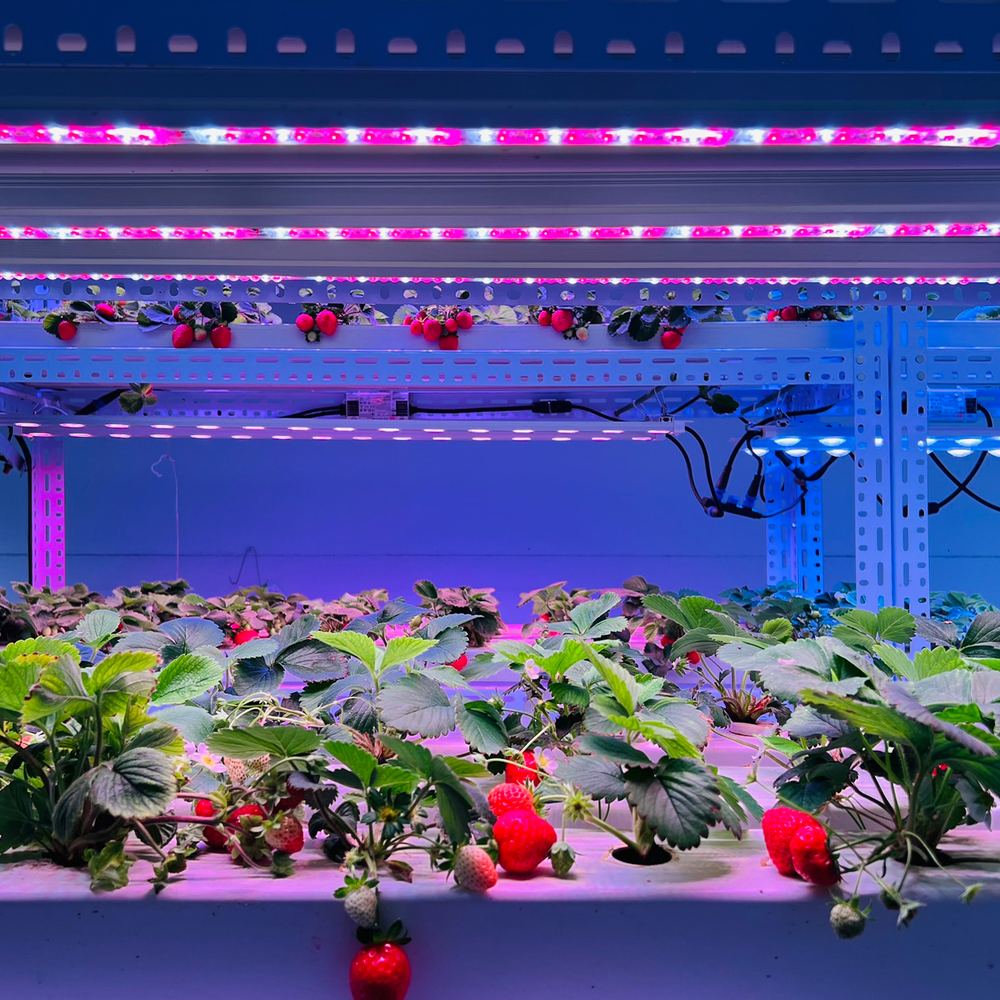
PPF and PPFD in one paragraph each
PPF (photosynthetic photon flux) is the total number of photosynthetically active photons leaving the luminaire every second. Its unit is micromoles per second, µmol/s. The value is a property of the fixture, measured at the fixture, and it does not change when you move the lamp.
PPFD (photosynthetic photon flux density) is the number of photosynthetically active photons that land on one square metre of surface every second. Its unit is µmol·m−2·s−1. It is a property of a position, not of a fixture, and it changes the moment you change the distance between the lamp and the leaves.
Both numbers count photons in the same spectral band: photosynthetically active radiation, conventionally defined as 400 to 700 nanometres, which is the waveband that drives photosynthesis. A micromole of photons is roughly 6.02 × 10¹⁷ photons.
Side-by-side comparison
| Metric | Unit | What it counts | Where the value refers to | How you obtain it |
|---|---|---|---|---|
| PAR | 400–700 nm | Photons plants can use for photosynthesis | A spectral band, not a quantity | Fixed by definition in the horticultural lighting standard |
| PPF | µmol/s | PAR photons leaving the luminaire each second | The fixture, summed over all directions | Luminaire test report or manufacturer datasheet |
| PPFD | µmol·m−2·s−1 | PAR photons arriving on one square metre each second | One point on the canopy surface | Measurement with a quantum sensor |
| DLI | mol·m−2·d−1 | PAR photons delivered to one square metre over a whole day | One point, accumulated across the photoperiod | PPFD integrated over the lighting hours |
| Photon efficacy | µmol/J | PAR photons delivered per joule of electricity consumed | The whole fixture, driver losses included | PPF divided by the electrical input power |
Why the distinction exists at all
Until the 1970s, and for most of the high-pressure sodium era, growers described light in radiometric terms such as PAR irradiance in watts per square metre. Plant science then moved to counting photons, because photosynthesis responds to the number of photons absorbed rather than to the total energy they carry. A blue photon carries more energy than a red photon, but either can drive a photochemical event. Counting photons is therefore the more biologically meaningful description, and the units that survived are the ones used above.
The vocabulary itself was only formalised recently. In 2017 the American Society of Agricultural and Biological Engineers published ANSI/ASABE S640, Quantities and Units of Electromagnetic Radiation for Plants (Photosynthetic Organisms), which defines 33 radiation metrics for horticultural lighting and aligns them with the existing conventions of the Illuminating Engineering Society, the CIE, and ISO. Before that publication, manufacturers used µmol/s and µmol·m−2·s−1 with somewhat different underlying assumptions, which is where much of the remaining confusion originates.
The same photon-counting logic explains why lumens and lux are poor guides for plant lighting. Both are photometric units weighted to the sensitivity of the human eye, which peaks in the green region of the spectrum; plants respond to blue and red far more than the eye does. A fixture can be dim in lux and bright in PPF, or the reverse. Foot-candle and lux readings are also instantaneous, so a single reading says very little about the total light a crop receives over a day.
From PPF to PPFD: the part that is pure geometry
Converting one figure into the other is an exercise in geometry, not in biology. If a fixture emits a fixed PPF, the photons spread out as they travel. Treating the luminaire as a single point source, doubling the distance quarters the photon flux density at the target:
PPFD ≈ PPF ÷ (distance)2 — valid only as a first approximation for a single, compact source.
A worked illustration makes the magnitude clear. Take a fixture that delivers 400 µmol·m−2·s−1 at 0.40 m directly below it. Under the inverse-square approximation the same fixture gives:
| Distance to canopy | Relative PPFD (1.00 at 0.40 m) | Indicative PPFD |
|---|---|---|
| 0.40 m | 1.00 | 400 µmol·m−2·s−1 |
| 0.60 m | 0.44 | 178 µmol·m−2·s−1 |
| 0.80 m | 0.25 | 100 µmol·m−2·s−1 |
| 1.20 m | 0.11 | 44 µmol·m−2·s−1 |
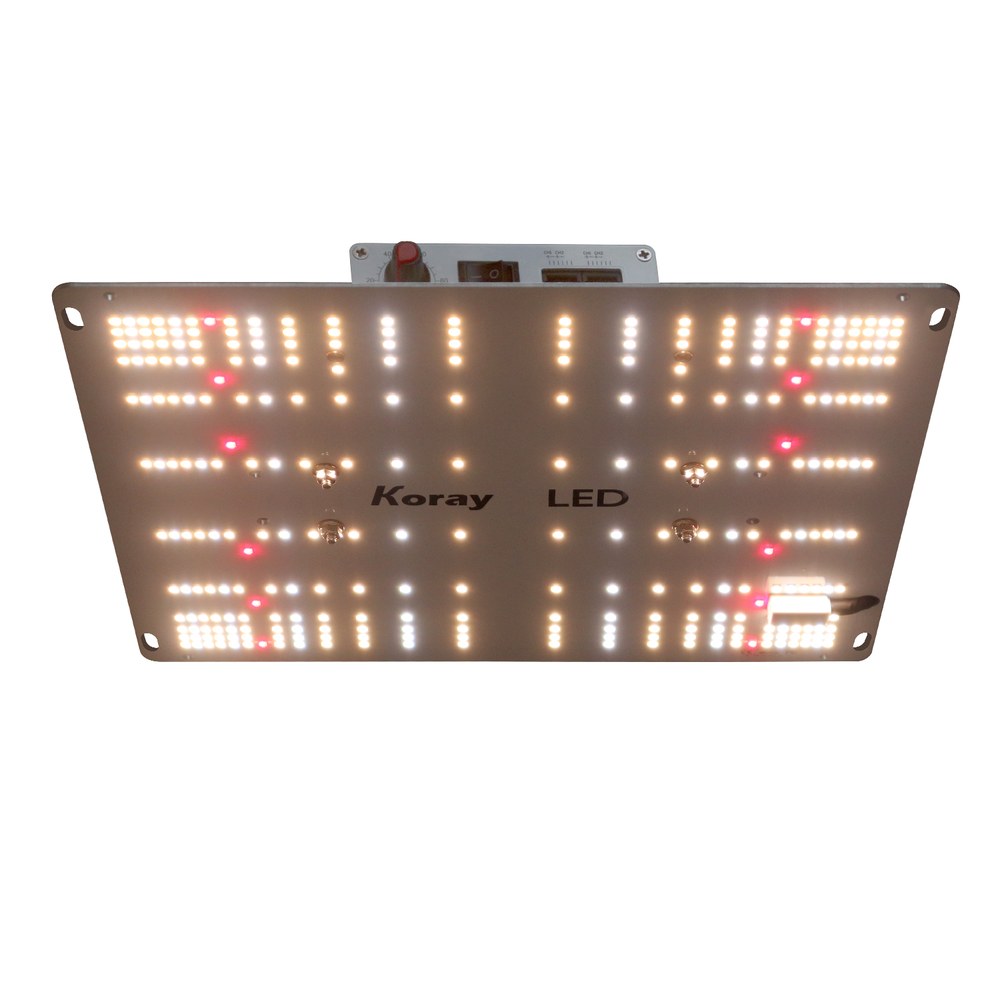
Reading daylight totals out of an instantaneous figure
PPFD is instantaneous, so on its own it cannot tell you how much light a crop received. Multiplying it by the hours the lights run gives the daily light integral, and the arithmetic factor for that conversion is small enough to keep in mind:
DLI (mol·m−2·d−1) = PPFD × photoperiod in hours × 0.0036
Worked through: 200 µmol·m−2·s−1 held for 16 hours delivers 200 × 16 × 0.0036 = 11.5 mol·m−2·d−1. For comparison, a common minimum target for high-quality floriculture crops inside a greenhouse is 10 to 12 mol·m−2·d−1; greenhouse crops that tolerate shade, such as phalaenopsis orchids, grow well at 4 to 6 mol·m−2·d−1; outdoor summer daylight in a cloudless sky can exceed 50 mol·m−2·d−1. Because DLI accumulates rather than being read at an instant, a sensor has to sample at least once every ten minutes to give a usable daily figure.
Using both numbers when you compare or audit a fixture
- Start with PPF, but ask where it came from. A PPF value is only comparable across manufacturers if it was measured over the full 400–700 nm band with a calibrated spectroradiometer or a quantum sensor. Values that arrive without an accompanying test report are hard to verify.
- Convert PPF to the PPFD your crop will actually see. Decide the mounting height and the area one fixture covers, then either calculate the density or, better, measure it with a quantum sensor in the room.
- Check the delivered figure against the crop target. Compare the measured PPFD at canopy level with published guidance for the species and stage, then adjust height, fixture count, or dimming.
- Separate fixture-level efficacy from emitter-level efficacy. Photon efficacy in µmol/J is the honest efficiency figure, and it is always lower than the number on the LED emitter datasheet because the driver, optics, and thermal design consume or lose part of the input energy. When two fixtures are compared, compare whole-fixture figures tested under the same conditions.
- Treat uniformity as a separate question. Two fixtures with identical PPF and identical central PPFD can distribute photons very differently across a bench, so a single spot reading is not enough to describe a canopy.
Where the numbers most often get misread
- Quoting PPF as if it were PPFD. A fixture with a large PPF hung too high can deliver less PPFD to the leaves than a smaller fixture hung correctly.
- Assuming PPFD scales linearly with distance. It does not; the drop follows roughly the square of the distance for a compact source.
- Treating a PPFD reading as a whole-room number. A quantum sensor reads one point. Canopy maps, not single readings, describe a bench.
- Comparing DLI across different photoperiods. The same DLI can be reached with high intensity over few hours or low intensity over many; those are not equivalent treatments for every species.
What this means when you select a fixture
For a given target PPFD over a stated area, PPF tells you how many fixtures are needed, and the mounting geometry tells you what density they will actually produce. Tiered racks and multi-layer benches usually favour long linear bars that spread photons evenly across a narrow tray, while a single high-bay luminaire suits an open canopy where one wide source can cover the whole bench. Where a crop needs a specific photon dose per day rather than a specific instant intensity, a dimmable, timer-controlled installation makes the daily total easier to hold steady across the season. Matching the fixture to the geometry of the growing area matters more than chasing the largest number on a box.
Frequently asked questions
Is PPF the same as PPFD?
No. PPF is the photon output of a luminaire per second, in µmol/s, and it stays the same wherever you place the lamp. PPFD is the photon flux density arriving at a surface, in µmol·m−2·s−1, and it changes with distance, beam shape, and the number of fixtures. They share a spectral definition but describe different things.
Can I calculate PPFD from PPF?
Only approximately, and only if you know the geometry. For a single compact source, dividing PPF by the square of the distance gives a rough figure directly beneath the fixture. For bars, panels, and multi-fixture installations the result is unreliable, and a quantum sensor measurement is the practical alternative.
Which number should I use to compare two grow lights?
Use PPF when comparing the light-producing capability of fixtures of similar type, and photon efficacy in µmol/J when comparing how much electricity each fixture needs to produce that light. Confirm both were measured over the full 400–700 nm PAR band under the same conditions. Then convert to PPFD at your intended mounting height, because that is the number the crop experiences.
Does a higher PPF always mean a better grow light?
No. A high PPF concentrated into a narrow beam produces hot spots and dim edges, and a high PPF fixture hung at the wrong height can waste photons outside the canopy. Uniformity, the match between beam angle and bench size, and the efficacy figure all matter alongside raw output.
Why do grow light datasheets use micromoles instead of watts?
Because photosynthesis is driven by the number of photons absorbed rather than by the energy they carry, and because a watt of input electricity is not a measure of useful light at all. Watts describe what the fixture consumes; micromoles per second describe what it delivers.
About the publisher
XineLam is a grow light manufacturer with 17 years of experience in the LED lighting industry and 300+ patents in China and internationally. The company designs and produces LED grow lights and lighting components for greenhouse, indoor, and vertical farming applications. This article is a technical explainer; it does not describe or recommend a specific product configuration, and any lighting decision should be verified by measurement in the installation concerned.
Sources
- All Things Lighting Association — Horticultural Lighting Metrics, by Ian Ashdown, P.Eng., FIES (discussing ANSI/ASABE S640 JUL 2017, Quantities and Units of Electromagnetic Radiation for Plants (Photosynthetic Organisms)).
- Purdue Extension publication HO-238-W — Measuring Daily Light Integral in a Greenhouse, by Ariana P. Torres and Roberto G. Lopez, Purdue University Department of Horticulture and Landscape Architecture.
- Michigan State University Extension — Daily light integral defined, by Erik Runkle, Department of Horticulture.