Grow Light Coverage Area: How to Match Footprint to Canopy
Almost every grow light is sold with a coverage figure — 2 by 4 feet, 4 by 4 feet, 1.2 by 1.2 metres. That figure is a range rather than a specification, because the same fixture covers a large area at a low PPFD and a small area at a high PPFD. This guide shows how to turn a fixture's photon output into the footprint you will actually get, and where the edges of that footprint start to fail.
- Why the coverage figure on a box is a range
- The three numbers that define a footprint
- How mounting height changes area and intensity together
- Overlap, edge drop-off and uniformity
- A worked layout: 4 by 4 metres at 300 micromol
- Coverage against target PPFD, and form-factor comparison
- Four sizing mistakes that show up in the crop
- What to measure before you buy
- Frequently asked questions
- About the publisher
- References
Why the coverage figure on a box is a range
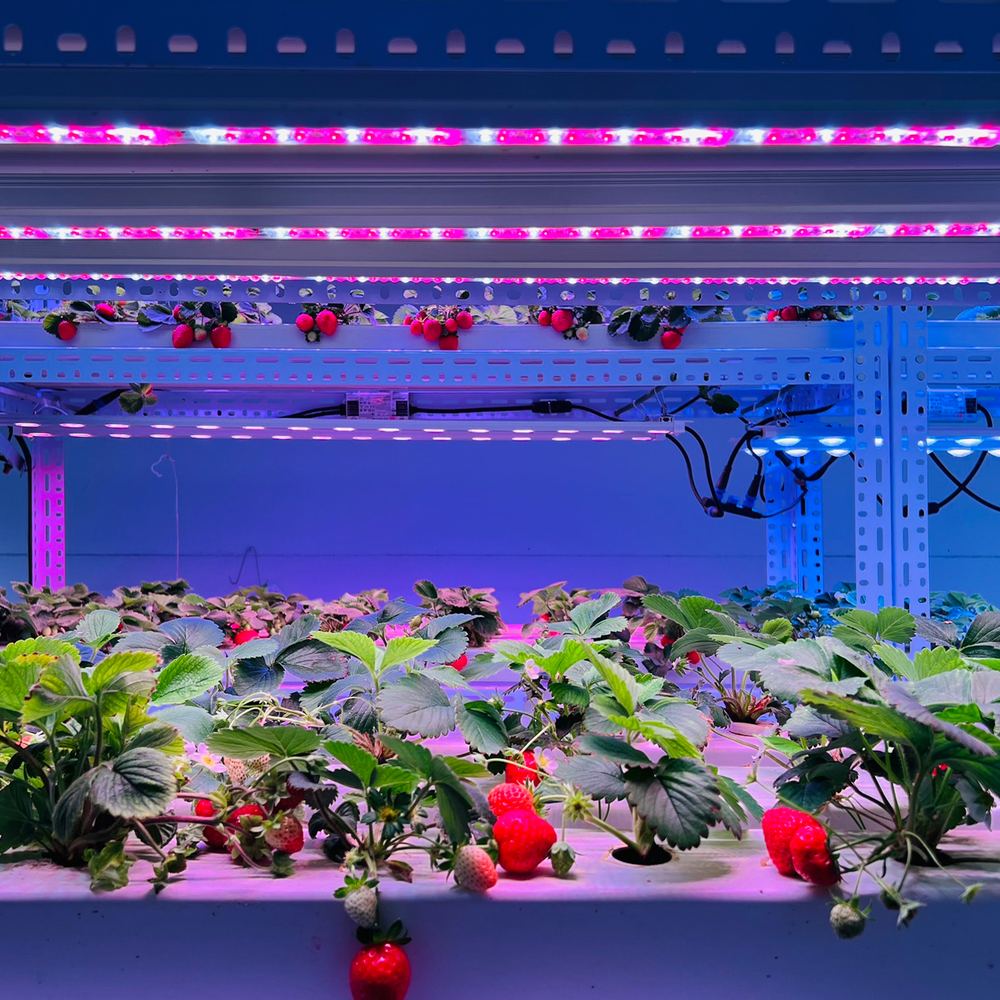
A coverage claim is always shorthand for three things that the seller rarely states together: a target PPFD, a mounting height, and an acceptable uniformity at the edge. "Covers 1.2 by 1.2 metres" usually means the fixture reaches a mid-range PPFD over that square at a mid-range height, measured at the centre. Change any one of the three assumptions and the number moves.
The dependency is not a marketing quirk; it is geometry. Virginia Tech Extension makes the trade-off explicit in its guide to the daily light integral: reducing the distance between the lamp and the plants raises PPFD significantly, but as lights get closer, the overall uniformity of light distribution decreases, and fewer plants can be effectively illuminated. A fixture that covers a bench at 60 cm covers a smaller patch at 30 cm — at about four times the intensity if it behaves like a point source.
Read a coverage claim, then, as a question: over how much area, at what PPFD, and how far down does the edge fall? A listing that gives only the first number has told you almost nothing you can design with.
The three numbers that define a footprint
Three quantities are enough to size a layout, and all three appear in manufacturer test reports rather than in marketing copy.
- PPF (photosynthetic photon flux), in micromol per second, is the total photon output of the fixture between 400 and 700 nm. It is a property of the lamp, not of the room.
- PPFD (photosynthetic photon flux density), in micromol per square metre per second, is what the canopy receives. It is PPF spread over area, so it depends on how the fixture is mounted.
- Delivery efficiency is the fraction of emitted photons that land on the canopy inside the area you care about. In an open, light-coloured room it is roughly 0.8 to 0.9; near dark walls, open sides or a low ceiling it drops, and the loss shows up at the edges first.
The relation is a division, which is why coverage is never a single number:
Two fixtures with the same PPF therefore cover different areas if you hold them to the same PPFD only when their delivery efficiency differs — and both cover twice the area if you accept half the PPFD. That is the entire content of a coverage claim.
How mounting height changes area and intensity together
A fixture's light spreads as it travels, so raising it enlarges the lit area and lowers the intensity inside that area. The rate of change depends on the shape of the source, and this is where growers most often guess wrong.
A compact source — a bulb, or a board whose width is small compared with the mounting distance — behaves approximately like a point source. Intensity falls with the square of distance: doubling the height quarters the PPFD. A 1.2 m linear bar is not point-like at 30 cm; along its length it behaves more like a line source, and doubling the distance to a point directly beneath the middle of the bar roughly halves rather than quarters the PPFD. That flatter falloff is why bars are mounted in rows with a spacing rule rather than treated as spotlights.
Overlap, edge drop-off and uniformity
Every fixture is brightest directly beneath its centre and dimmer towards its edge. In a single-fixture layout the outer band typically reads 20 to 40 percent below the centre, which is why two small fixtures usually beat one large one over the same bench: the overlap cancels the drop-off.
For linear bars, the working rule is to space fixtures at roughly 0.8 to 1.0 times the mounting height above the canopy, measured centre to centre. Closer spacing raises uniformity and the fixture count; wider spacing saves fixtures and produces stripes of light that show up as uneven growth. For panels and boards, overlap the rated footprints by about 10 to 15 percent at the edges.
Uniformity is measured, not assumed. Take readings on a grid — a 3 by 3 grid is enough for a bench, 5 by 5 for a room — at canopy height, and compare the lowest reading inside the footprint with the highest. A minimum-to-maximum ratio of 0.7 or better is a reasonable design target for a production bench; below about 0.6 the difference is visible in plant size at harvest.
A worked layout: 4 by 4 metres at 300 micromol
Take a 16 m² room, a target of 300 µmol/m²/s at canopy, and a 16-hour photoperiod. The photoperiod converts the target into a daily light integral:
That is a reasonable target for a fruiting crop and generous for lettuce. Now size the fixture count at a delivery efficiency of 0.85:
Fixtures rated at 1,000 µmol/s each would therefore need 5.6 units — six in practice, arranged as two rows of three so that the overlap evens out the middle of the room. Six fixtures at 1,000 µmol/s give an installed PPF of 6,000 µmol/s, about 6 percent above the calculated requirement, which is a sensible margin for wall losses and for lamps that will be run at less than full power.
Note what the arithmetic did not use: wattage, lumens, or the coverage number on the box. Those are inputs to a purchase decision, not to a layout.
Coverage against target PPFD, and form-factor comparison
| Fixture PPF | At 250 µmol/m²/s | At 300 µmol/m²/s | At 400 µmol/m²/s | Square side at 300 |
|---|---|---|---|---|
| 600 µmol/s | 2.0 m² | 1.7 m² | 1.3 m² | 1.30 m |
| 1,000 µmol/s | 3.4 m² | 2.8 m² | 2.1 m² | 1.68 m |
| 1,800 µmol/s | 6.1 m² | 5.1 m² | 3.8 m² | 2.26 m |
| 2,400 µmol/s | 8.2 m² | 6.8 m² | 5.1 m² | 2.61 m |
The same photon output behaves differently depending on how the fixture is built, which is why two lamps with identical PPF are not interchangeable in a room:
| Form factor | Typical dimensions | Mounting height above canopy | Spacing rule | Uniformity character | Best fit |
|---|---|---|---|---|---|
| Linear bar | 1.0–1.5 m long, 5–10 cm wide | 15–40 cm | 0.8–1.0 × height, centre to centre | Even along the bar, striped across rows | Benches, multi-tier racks, interlighting |
| Top-light module | 0.3–0.6 m square | 0.6–2.0 m | Overlap footprints by 10–15% | Strong centre, needs overlap | Greenhouse bays, tall crops |
| Quantum board / panel | 0.3–0.6 m square, passive | 30–60 cm | 0.9–1.1 × height | Point-like, sharp falloff at edges | Small rooms, tents, propagation |
| Interlighting bar | 1.2–2.4 m, narrow beam | Inside the canopy | One bar per row or per 40–60 cm | Deliberately local, not area-wide | Vine crops, dense canopies |
Four sizing mistakes that show up in the crop
- Sizing by watts per area. Watts describe input power, not photons. A 2.6 µmol/J fixture and a 1.8 µmol/J fixture of the same wattage differ by about 44 percent in PPF, and therefore by about 44 percent in the area they cover at a fixed PPFD.
- Counting the lit area as the covered area. Light spills past the useful footprint. If the edge of the footprint sits below your target, plants in that band are not covered in any useful sense, however bright the floor looks.
- Ignoring the row ends. A run of bars lights the middle of a bench better than its ends, because the end receives light from one side only. End walls, doors and aisle edges are where deficiency appears first.
- Measuring at the centre only. A centre reading tells you the peak. It says nothing about whether the plants at the edge of the bench will finish with the plants in the middle.
What to measure before you buy
Three checks settle most of the uncertainty. First, ask for the PPF and the efficacy from a test report, not from a product title. Second, ask for a PPFD map at the mounting height you intend to use, and look at the lowest values inside the map rather than the peak. Third, once installed, take your own grid readings at canopy height and convert them to a daily light integral with the photoperiod you actually run — the DLI is the number the crop responds to, and it is the one that reveals a layout that is bright in the middle and short at the edges.
Frequently asked questions
How many watts per square foot do I need for a grow light?
Watts per area only works when you also know the fixture efficacy. Convert first: a fixture rated at 2.6 µmol per joule and drawing 300 W delivers about 780 µmol/s of PPF. At a delivery efficiency of 0.85 into a 300 µmol target that is roughly 2.2 m² of canopy, or about 137 W per square metre. A 2.0 µmol per joule fixture of the same wattage covers about 1.7 m² at the same target.
Can I lower the light to cover a smaller area with more intensity?
Yes, and Virginia Tech Extension describes both consequences: PPFD rises as the distance falls, but overall uniformity of light distribution decreases, so fewer plants are effectively illuminated. Lowering a fixture converts one bright centre into a small well-lit patch, which is useful for seedlings and poor for a full bench.
What uniformity should I aim for across the canopy?
A common design rule of thumb is that the lowest reading inside the paid footprint should be at least 70 percent of the highest, measured on a grid at canopy height. Below roughly 60 percent, plants at the edges usually finish smaller and later than plants under the centre, even when the average PPFD looks correct.
Does a reflective wall or tent increase the coverage area?
It raises the light that reaches the canopy at the edges, so the usable footprint grows a little and the uniformity improves, especially in a small enclosed room. It does not replace fixture overlap: the outer 10 to 15 percent of any single fixture still falls off sharply, and reflected light cannot correct a hotspot under the centre of the lamp.
About the publisher
Zhongshan City Ruixian Electronics Factory (XineLam) designs and manufactures LED lighting and LED grow light modules, with 17 years of experience in LED lighting and 300+ patents in China and internationally. The company supplies linear bars, top-light modules, interlighting fixtures and dimmable quantum boards, and publishes test data for PPF and efficacy rather than coverage claims. Product information is available on the product index, and technical enquiries go through the contact page.
References
- Virginia Cooperative Extension. Calculating and Using Daily Light Integral (DLI): An Introductory Guide. https://pubs.ext.vt.edu/SPES/spes-720/spes-720.html — used for the relationship between mounting distance, PPFD and uniformity, and for the DLI calculation method.
- DesignLights Consortium. Horticultural Lighting Technical Requirements, V4.0. https://designlights.org/our-work/horticultural-lighting/technical-requirements/hort-v4-0/ — the qualification framework under which horticultural fixtures are tested and rated, and the reason PPF and efficacy figures are comparable across brands while coverage claims are not.