How to Measure PPFD Without a Quantum Sensor: Six Practical Options
PPFD is the number that decides whether a grow light is doing its job, and a quantum sensor is the instrument designed to report it. That leaves a practical gap: most growers, installers and buyers do not own one. This guide works through the six options that remain, what each one actually measures, how much error each one carries, and how to convert whatever number you obtain into a daily light integral you can compare against a crop target.
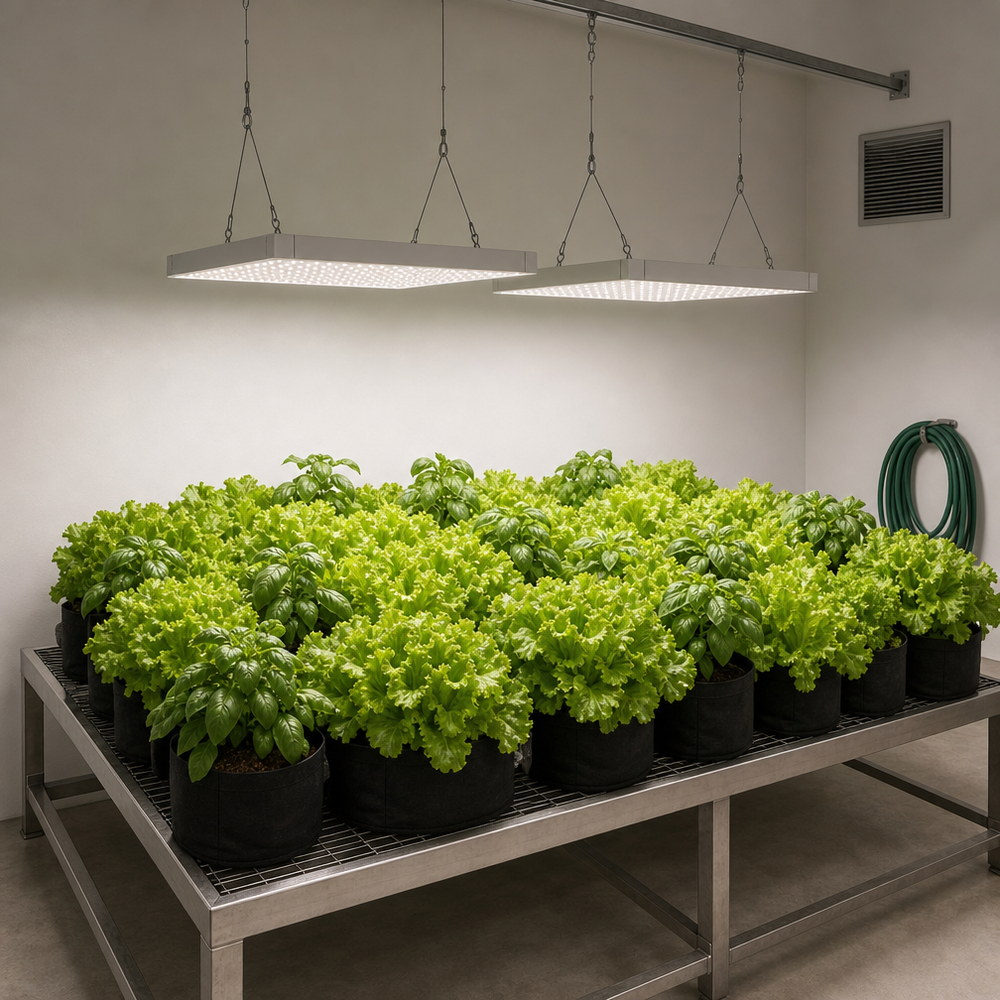
What PPFD measures, and what a quantum sensor reports
Photosynthetically active radiation (PAR) is the waveband from 400 to 700 nm that drives photosynthesis. In 1972 McCree showed that the photosynthetic response of a leaf tracks the number of photons in that band rather than the energy they carry, which is why plant lighting is counted in photons rather than watts. Three quantities follow from that:
- Photosynthetic photon flux (PPF) — total photons per second emitted by a source, in µmol/s. This is the fixture-level number.
- Photosynthetic photon flux density (PPFD) — photons per second arriving on one square metre of surface, in µmol m-2 s-1. This is the canopy-level number you measure.
- Daily light integral (DLI) — PPFD accumulated over a photoperiod, in mol m-2 d-1. This is the crop-facing number.
The conventional instrument is a quantum sensor: a filtered photodiode whose response is shaped to count photons between 400 and 700 nm. Its weakness is worth stating plainly, because it shapes every alternative below. A quantum sensor returns one aggregate number and, as measurement-instrument maker Gigahertz-Optik puts it in its horticultural application note, a quantum device “provides no spectral information”. It cannot tell you what share of the light is red, blue or far-red. Broader plant-response metrics now exist — ANSI/ASABE S640 defines separate ultraviolet photon flux density (280–400 nm) and far-red photon flux density (700–800 nm) — and none of them is visible to a plain quantum sensor.
Six ways to get a PPFD number
The methods below are ordered by directness. All of them end in µmol m-2 s-1, but they do not end in the same quality of answer. Cost bands are relative to one another, not currency amounts, because instrument prices move.
| Method | Relative cost | What it actually measures | Dominant error source | Best used for |
|---|---|---|---|---|
| Quantum (PAR) sensor, spot | $$$ | Photons 400–700 nm at one point | Cosine response at low light angles; calibration age | Routine verification; final sign-off |
| Line quantum sensor | $$$$ | Average over a sensor bar | Same as above, averaged over length | Spatial averages across a bed or tray |
| Spectral light meter or spectroradiometer | $$$$$ | Full spectrum, point by point | Cost; operator technique | Research; spectrum claims; spectral tuning |
| Lux meter with a conversion factor | $$ | Eye-weighted illuminance | Spectrum mismatch between factor and fixture | Repeatable relative readings at low cost |
| Phone app with diffuser | $ | Ambient light sensor or camera response | Uncalibrated sensor; assumed spectrum preset | Quick before/after comparisons |
| Manufacturer PPFD map | Free | Modelled or measured fixture output | Map conditions must be reproduced exactly | Planning a layout before any purchase |
Method 1: convert lux readings with a spectrum-specific factor
A lux meter is cheap, robust and everywhere. The conversion works like this:
That factor is not a constant. It depends on the spectral power distribution of the light, because lux weights photons by the photopic response of the human eye, which peaks near 555 nm and falls away towards both ends of the visible band. Published factors — the standard reference is Thimijan and Heins (1982), reproduced in the conversion tables published by instrument maker Apogee Instruments — vary by source type:
| Light source | Lux → PPFD factor |
|---|---|
| Sunlight | 0.0185 |
| Ceramic metal halide, 3100 K, spectrum shifted to red | 0.0170 |
| Ceramic metal halide, 4200 K | 0.0154 |
| Metal halide | 0.0141 |
| Cool white fluorescent | 0.0135 |
| Double-ended high pressure sodium | 0.0130 |
| Mogul base high pressure sodium | 0.0122 |
Worked example from the same source: full sunlight of 108,000 lux converts to 2000 µmol m-2 s-1 (108,000 × 0.0185).
The practical consequence is that a lux meter gives a trustworthy relative reading and an untrustworthy absolute one unless the factor is right. For comparing two dimming settings of the same fixture, or the same fixture at two heights, the factor cancels out and the lux meter is entirely adequate.
Method 2: phone apps with a diffuser
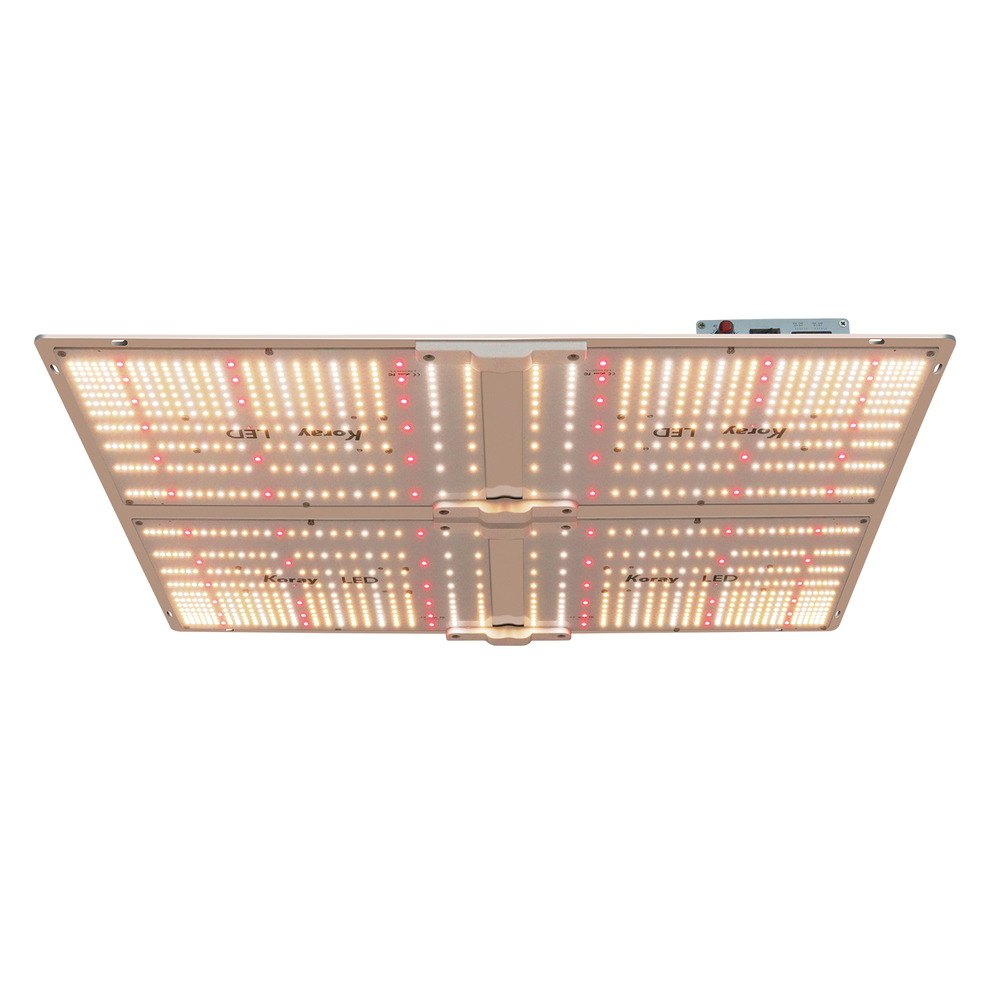
Several phone applications estimate PPFD by reading the ambient light sensor or the camera through a translucent diffuser, then applying a calibration and a spectrum preset. Two limits matter. First, the sensor in a phone was designed for display brightness, not for radiometry, so its spectral response is not shaped to the PAR band. Second, the app must assume a spectrum; choose the wrong preset and the error grows. The honest use of a phone is as a comparator: take readings in the same app, with the same diffuser, at the same height, and compare positions or settings. Do not treat the absolute figure as calibrated.
Method 3: the fixture's own PPFD map
A reputable supplier publishes a PPFD map: a grid of values across a stated area, at a stated mounting height, at a stated dimming level, usually at 100 per cent output. Michigan State University Extension points out in its quantum sensor guidance that the only way to answer most light questions is to learn to select and use a quantum sensor properly — and one of the most common uses of that sensor is to verify a supplier's map under real conditions. When you read a map:
- Reproduce the height, dimming setting and measurement grid exactly; a map taken at 30 cm does not describe the light at 60 cm.
- Look for the lowest value in the grid, not only the peak at the centre.
- Note whether the map is modelled or measured, and whether the measurement was made with a calibrated quantum sensor.
- Expect the canopy to see less than the map implies once leaves shade each other.
Method 4: borrow, rent or share a sensor
A single calibrated reading can validate months of work with a cheaper method. Extension services, university horticulture departments, grower groups, lighting distributors and testing laboratories all hold quantum sensors, and many will loan one for a day. If you are averaging across a bed rather than checking a point, ask for a line quantum sensor: MSU Extension's guidance notes that multiple diode sensors arranged as a line quantum meter are among the most accurate ways to measure light in a greenhouse, precisely because they average over length instead of sampling a single spot.
Method 5: measure like you mean it
Most measurement error comes from technique rather than from the instrument, and the same rules apply whichever of the methods above you use.
- Measure at the canopy, at the height of the top leaves, not at the fixture and not on the floor.
- Keep the sensor level. Quantum sensors under-read when light arrives at a shallow angle, because cosine correction is never perfect.
- Do not shade the sensor. Your body and clothing reflect and block light; stand to the side and read from the same side each time.
- Sample a grid. Nine points across the grown area will expose the fall-off at the edges that a centre reading hides.
- Record conditions. Height, dimming setting, photoperiod, ambient temperature and the date are part of the measurement; without them a number cannot be repeated.
- Repeat on a schedule. LED output falls gradually, so a reading at installation is a baseline, not a permanent fact.
Method 6: convert PPFD into DLI
PPFD on its own does not tell you whether a crop is receiving enough light, because a high PPFD over a short photoperiod can deliver less total light than a moderate PPFD over a long one. DLI combines the two:
The 0.0036 converts seconds to hours and micromoles to moles: 3600 s ÷ 1,000,000 µmol/mol.
| PPFD (µmol m-2 s-1) | 12 h | 16 h | 18 h |
|---|---|---|---|
| 200 | 8.64 | 11.52 | 12.96 |
| 400 | 17.28 | 23.04 | 25.92 |
| 600 | 25.92 | 34.56 | 38.88 |
| 800 | 34.56 | 46.08 | 51.84 |
| 1000 | 43.20 | 57.60 | 64.80 |
Read the table as a two-way trade. A fixture delivering 400 µmol m-2 s-1 for 16 hours matches neither the 600 µmol fixture at 12 hours (25.92 mol) nor the same 600 µmol fixture at 16 hours (34.56 mol). Where a crop target is expressed as a DLI — Virginia Tech Extension's introductory guide to calculating and using DLI is a good starting point for crop values — the photoperiod is a design variable, not a detail.
Where the remaining error hides
- Spectrum mismatch. The largest single error in any indirect method. A factor taken from the wrong source type can move the answer by tens of per cent.
- Height drift. Light falls off sharply with distance, so a few centimetres of unrecorded difference between the map and the measurement is enough to explain a disagreement.
- Dimming setting. A reading taken at 60 per cent is not a reading at 100 per cent, and drivers do not always dim linearly in output terms.
- Sensor ageing. Quantum sensors and photodiodes drift; a sensor that has never been recalibrated should not be treated as a reference.
- Reflection. White walls, reflective film and wet floors all add light that a free-air map does not include.
When to stop improvising and buy a sensor
The indirect methods are a reasonable steady state when you compare within one installation. The economics change when any of the following becomes true: you operate several fixtures or several rooms and need to compare them with each other; you change diodes, drivers or dimming settings and need to prove the result; you sell or install lighting and must document delivered light; or you are chasing a deficiency that you cannot diagnose by eye. At that point a spot quantum sensor converts a recurring argument into a repeatable measurement, and the readings from the cheaper methods become a cross-check rather than the source of record.
Frequently asked questions
Can a phone really measure PPFD?
A phone contains no quantum sensor. An app with a clip-on diffuser reads illuminance or raw camera response and applies a conversion factor, so its accuracy depends on how well that factor matches your fixture's spectrum. Use phone readings as a relative index for repeatable comparisons under one fixture, not as a calibrated absolute value.
Is a lux meter accurate enough for a grow light?
Only with the correct conversion factor. Published factors run from about 0.0122 for high pressure sodium to 0.0185 for sunlight, and each belongs to a specific source type. Because a lux meter weights light by human eye response, an LED spectrum needs its own factor, taken from the fixture manufacturer or from a spectral measurement, rather than an assumed one.
How many measurement points do I need?
A single centre reading says almost nothing about a canopy. Measure a grid of at least nine points across the grown area at the same distance from the fixture, and record the average together with the lowest value. The lowest value is what the weakest plants in the bed experience.
At what height should PPFD be measured?
At the top of the canopy, which is the surface the plants actually use. Keep the sensor level: a sensor tilted away from the incoming light under-reads because cosine correction is imperfect.
Do I need a quantum sensor for one small crop?
Usually not as a purchase. For a single small crop, a supplier's PPFD map plus one borrowed sensor reading to verify it is often sufficient. Buy a sensor when you run several fixtures or rooms, change fixtures or dimming settings, or need to document light levels for a customer or an auditor.
References
- Michigan State University Extension, How to Measure Greenhouse Light (Currey, Lopez, Krug, Owen and Whipker, 2018). https://www.canr.msu.edu/resources/how-to-measure-greenhouse-light
- Michigan State University Extension, Know your light levels (Floriculture greenhouse toolkit series). https://www.canr.msu.edu/floriculture/uploads/files/know-your-light-levels.pdf
- Apogee Instruments, PPFD to Lux conversion, conversion factors after Thimijan, R. W. and Heins, R. D. (1982), Photometric, Radiometric, and Quantum Light Units of Measure: A Review of Procedures for Interconversion, HortScience 18:818-822. https://www.apogeeinstruments.com/conversion-ppfd-to-lux/
- Gigahertz-Optik, application note 006, Measurement of LED Grow Lights used in Horticulture (definitions of PAR, PPF, PPFD and DLI; reference to McCree 1972 and ANSI/ASABE S640). https://www.gigahertz-optik.com/en-us/app-groups/general-and-special-lighting/measurement-of-led-grow-lights-used-in-horticulture/
- ANSI/ASABE S640 (July 2017), Quantities and Units of Electromagnetic Radiation for Plants (Photosynthetic Organisms). https://elibrary.asabe.org/abstract.asp?aid=48303&t=2
- Virginia Cooperative Extension, Calculating and Using Daily Light Integral (DLI): An Introductory Guide, publication SPES-720. https://www.pubs.ext.vt.edu/SPES/spes-720/spes-720.html
About the publisher
Zhongshan City Ruixian Electronics Factory (XineLam) has 17 years of experience designing and manufacturing LED lighting, and holds 300+ patents in China and internationally. The company builds LED grow light panels and modules for controlled-environment agriculture. This article is written as technical reference material for growers, installers and specifiers, not as a product brochure.