How Even Is Your Grow Light? Measuring PPFD Uniformity and Fixing Hot Spots
A grow light can report a perfectly satisfactory average PPFD and still leave part of the canopy starved and part of it over-lit. The average tells you the daily dose; it says nothing about how that dose is distributed. This guide covers the two metrics that expose the distribution, how many points you actually need to measure, and the fixture and mounting changes that move uniformity in the right direction.
Why the average is not enough
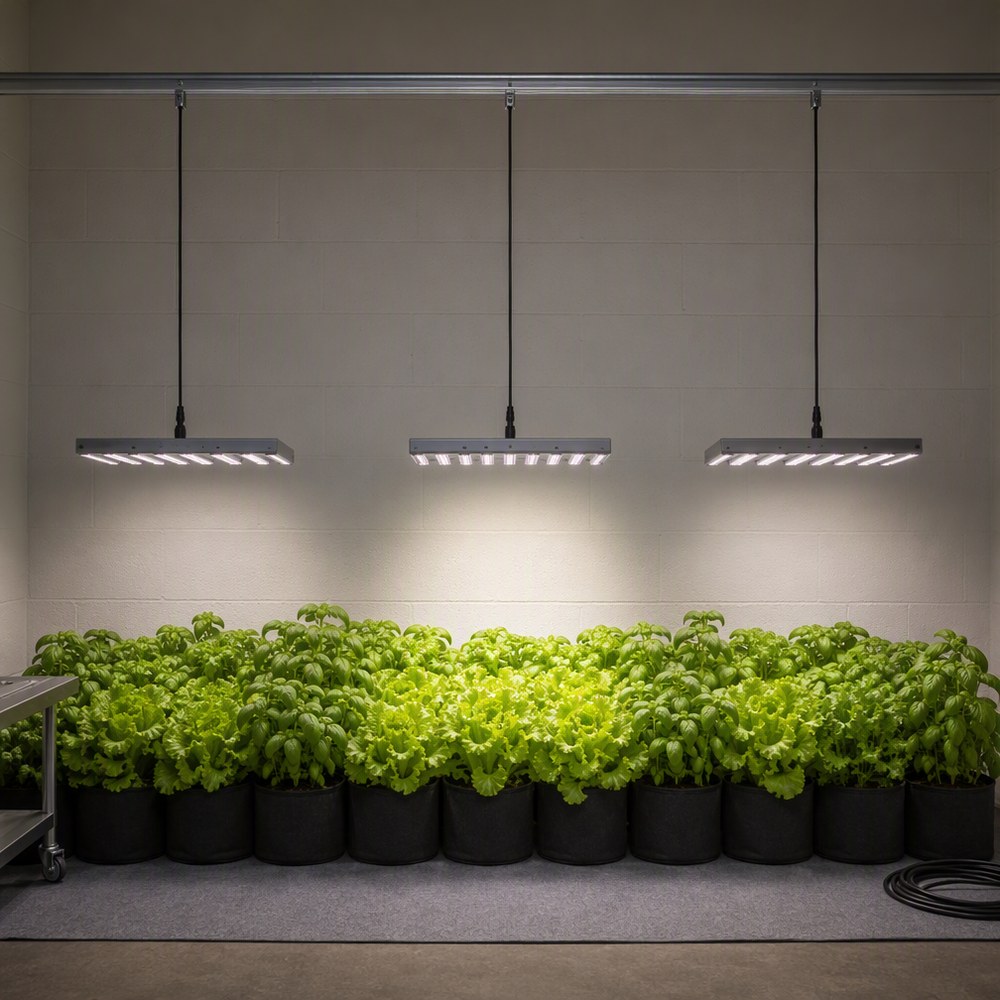
PPFD is measured at a point. A bench-level average is therefore a summary of a set of point readings, and the same average can come from a flat map or from a map with a bright band down the middle and two dim strips at the edges.
That difference matters for three reasons. Yield weight and quality are set by the dimmest part of the canopy, not by the average, so a room that meets its DLI target on paper can still under-perform if the dim zones sit below the threshold where photosynthesis is light-limited. A hot spot is also a purchase decision: photons concentrated under a fixture are photons the canopy cannot use, and they are paid for on every electricity bill. And a hot spot is a crop-safety issue, because the same fixture height that is correct on average may exceed a tender crop's tolerance directly beneath the bars.
The problem is measurable rather than theoretical. A study of light heterogeneity across a working controlled-environment facility used the room's existing variation in both light quantity and quality to evaluate effects on crop output, rather than treating the growing area as one uniform environment — the practical message being that a single room-average figure conceals the variable that crops actually experience.
Two metrics that expose the distribution
Uniformity is normally reported either as a ratio of extreme readings or as a coefficient of variation. They answer different questions and are best used together.
| Metric | Definition | What it tells you | Where it misleads |
|---|---|---|---|
| Average PPFD | Mean of all grid readings, µmol/m²/s | The dose basis for DLI | Says nothing about spread; hides both hot spots and dim zones |
| Minimum / maximum | Lowest reading divided by highest, percent | Worst-case spread across the measured area | Dominated by one stray high or low point |
| Minimum / average | Lowest reading divided by mean, percent | How far the weakest zone falls below the intended level | Blind to over-supply elsewhere |
| Coefficient of variation (CV) | Standard deviation divided by mean, percent | Overall dispersion; comparable between rooms and fixtures | An averaging metric — a single small hot spot barely moves it |
| Maximum / average | Highest reading divided by mean, percent | How far the hottest zone overshoots, relevant to scorch risk and energy waste | Insensitive to the size of the dim area |
What real measured maps look like
Published work gives a useful sense of the magnitudes involved. A study on tomato published in Frontiers in Plant Science quantified light distribution for three lighting arrangements and reported the coefficient of variation within the horizontal plane as shown below.
| Lighting arrangement | CV, horizontal direction |
|---|---|
| Intra-canopy LED lighting | 48% |
| Top LED lighting | 43% |
| Intra-canopy combined with top LED lighting, 50/50 | 37% |
Two conclusions transfer well to smaller rooms. First, a CV in the tens of percent is normal in real installations, not a sign that something is broken; the spread between the best and worst arrangement in that trial was 11 percentage points. Second, the winning arrangement was a combination, and the study reported that combined intra-canopy plus top lighting absorbed light more uniformly than either approach alone in all measured directions.
There is also direct work on microgreens. A study of light heterogeneity in controlled environment agriculture used the existing variation in light quantity and quality across a working vertical farm to evaluate the effect on microgreen biomass. Its value here is the method: variation is quantified position by position rather than inferred from an average.
How many points do you need to measure?
The number of readings decides what the map can resolve. A five-point check cannot reveal the bands that form between two fixtures, because too few readings fall in the gap.
| Grid | Readings | Resolves | Use it for |
|---|---|---|---|
| Centre plus four corners | 5 | Gross centre-to-edge difference | A quick check after moving or adding a fixture |
| 3 × 3 grid | 9 | Centre, edge and corner zones separately | Routine commissioning of a bench or tier |
| 5 × 5 grid | 25 | The dim bands that form between adjacent fixtures | Diagnosing a map that looks banded after installation |
| Dense mapping, tens to hundreds of points | 50 and above | Whole-area behaviour, including perimeter effects | Comparing fixture options before a purchase |
Three conditions apply to any grid. Measure at canopy height rather than at the shelf, keep the sensor horizontal, and re-measure once the canopy fills the space, because a map taken over young plants does not describe the same room at harvest. One grower light-mapping exercise reported PPFD increasing by more than 25 percent at some locations simply as the crop grew from about 4 cm to about 10 cm, with no change to the fixture setting at all.
What causes hot spots and dim edges
Most non-uniform maps come down to five causes, and each one points at a different correction.
| Cause | What the map shows | Correction |
|---|---|---|
| Fixture spacing wider than the fixture's throw | A bright band under every bar and a dim band between bars | Reduce the spacing, or add a bar, so the footprints overlap before they fall off |
| One wide fixture over a wide bench | A high centre reading rolling off steadily toward both long edges | Split the same output into two or more narrower fixtures at the same total power |
| Hanging height too low | A high peak with a steep fall-off, and a small usable footprint | Raise the fixture and recover the lost average through photoperiod or added output |
| Perimeter surfaces | Readings at the edges that differ from the interior in a way that follows the walls | Treat wall reflectivity as a deliberate choice; reflective surfaces raise perimeter readings |
| Canopy growth over the cycle | A map that quietly changes between transplant and harvest | Fix the height against a full canopy, not against a young one |
The order to apply the fixes
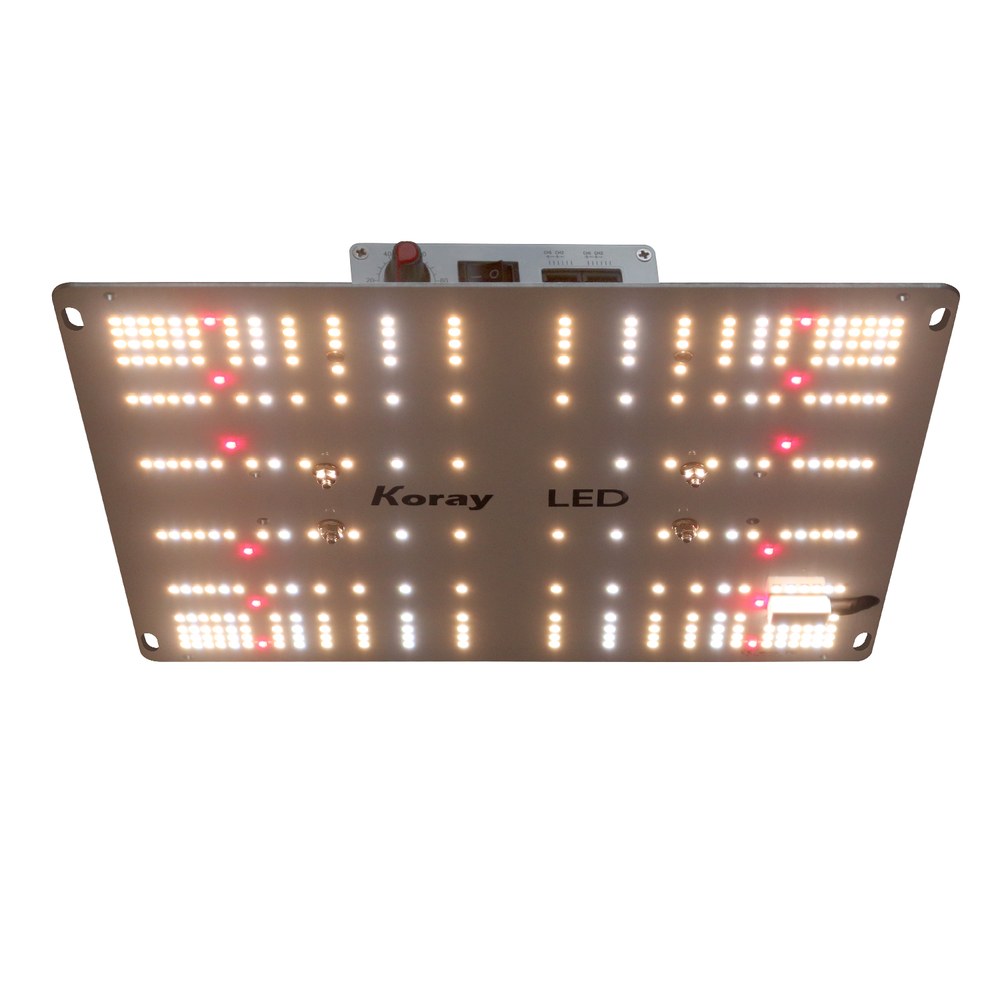
Uniformity work is cheaper when it starts with geometry and ends with purchasing. Raising a fixture costs nothing but reduces the peak, so the honest sequence is: map first, then change spacing and height, then decide whether the remaining spread justifies an additional fixture.
- Map the area on a grid appropriate to the diagnosis, at canopy height, and record average, minimum, maximum and CV.
- If the map is banded, change the spacing between fixtures first; bands are a spacing symptom, not a height symptom.
- If the map slopes from the centre to the edges, raise the fixture or split the output across more fixtures.
- Re-map after every change. One adjustment at a time, or the responsible variable cannot be identified.
- Record the final map with the fixture height, spacing and dimmer setting, so the setting survives the next crop change.
FAQ
What is a good PPFD uniformity value?
There is no single figure that applies to every crop and mounting. CV in the tens of percent is normal in real installations: a published tomato trial reported 37 to 48 percent depending on the lighting arrangement. Practically, a minimum-to-average ratio that keeps the dimmest zone above the level where the crop becomes light-limited matters more than any single target.
How many points should I measure for PPFD uniformity?
Nine readings in a 3 × 3 grid are enough for routine commissioning of one bench or tier. Move to a 5 × 5 grid if the map looks banded, because the dim strips between adjacent fixtures fall between the points of a coarse grid.
Why is my PPFD uneven even though the fixtures are evenly spaced?
Even spacing means the centres of the footprints are even; it does not mean the light between them is. Where the throw of each fixture is narrower than its spacing, the light falls away before the neighbouring fixture's output arrives, and a dim band forms in the gap.
Does raising the fixture improve uniformity?
Yes, and it costs nothing but peak intensity: a greater distance flattens the distribution while lowering the maximum. If the average then drops below target, recover it through a longer photoperiod or additional output rather than by lowering the fixture back down.
Should I measure uniformity at shelf height or canopy height?
At canopy height, and again once the canopy is full. The map is a property of the distance from the fixture to the leaves, so a measurement taken over young plants describes a room that no longer exists by harvest.
About the publisher
Zhongshan City Ruixian Electronics Factory (XineLam) has 17 years of experience designing and manufacturing LED lighting, and holds 300+ patents in China and internationally. This article is written as technical reference material for growers and specifiers. Where a figure comes from a published source it is cited below; recommendations about mounting and spacing are general practice and should be verified by measurement in the room concerned.
Sources
- Frontiers in Plant Science, Consequences of intra-canopy and top LED lighting for uniformity of light distribution in a tomato crop, 2023.
- PMC, The impact of light heterogeneity in controlled environment agriculture on biomass of microgreens.
- Urban Micro, Microgreens Light Part V – Understanding PPFD and DLI with Calculations, grower light-mapping series, 2025.